 Global| Jun 04 2003
1Q Productivity Revised Higher
by:Tom Moeller
|in:Economy in Brief
Summary
Nonfarm labor productivity last quarter was revised up right in line with Consensus expectations for 1.9% growth. The revision stemmed from an upward revision to output growth to 1.8% from the initial estimate of 1.4%. The initial [...]
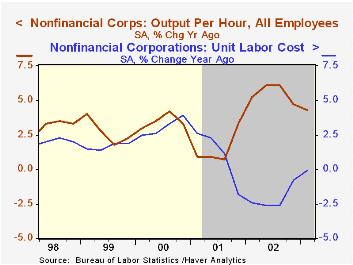
Nonfarm labor productivity last quarter was revised up right in line with Consensus expectations for 1.9% growth.
The revision stemmed from an upward revision to output growth to 1.8% from the initial estimate of 1.4%. The initial estimate of a 0.1% decline in hours worked was unchanged.
Unit labor cost growth was lowered to 1.5% from 1.9%. Growth in compensation was about unchanged at 3.4%.
Productivity in the nonfinancial corporate sector, a figure derived from the income side of the National Income and Product Accounts, surged 2.9% (4.3% y/y). Despite this strength, unit labor costs rose 1.7% (-0.1% y/y). It was the first quarterly rise in unit costs since 1Q2001 and was driven by 4.7% (4.2% y/y) growth in compensation.
Manufacturing sector productivity growth in 1Q was lowered slightly to 1.9% (2.8% y/y).
| Nonfarm Business Sector (SAAR) | 1Q '03 Revised | 1Q '03 Prelim. | 4Q '02 Final | Y/Y | 2002 | 2001 | 2000 |
|---|---|---|---|---|---|---|---|
| Output per Hour | 1.9% | 1.6% | 0.7% | 2.4% | 4.8% | 1.1% | 2.9% |
| Compensation | 3.4% | 3.5% | 3.9% | 3.3% | 2.4% | 2.7% | 7.0% |
| Unit Labor Costs | 1.5% | 1.9% | 3.2% | 0.8% | -2.3% | 1.6% | 3.9% |
by Tom Moeller June 4, 2003
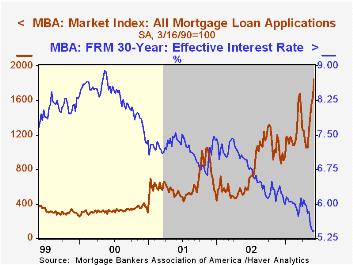
The index of mortgage applications compiled by the Mortgage Bankers Association rose to a new record last week. During the last five weeks mortgage applications have risen by 76.7% as interest rates have plumbed new lows.
Applications to refinance jumped 12.9% w/w to a new record and have nearly doubled during the last five weeks.
Applications for home purchase also surged 16.4% w/w and were up 11.6% during the month of May following strong gains in the prior two months.
Interest rates on a conventional 30-Year mortgage rose slightly w/w to 5.41% versus 6.13% averaged in December. The effective rate on a 15-year mortgage fell to 4.93% versus 5.55% averaged in December.
The Mortgage Bankers Association surveys between 20 to 35 of the top lenders in the U.S. housing industry to derive its refinance, purchase and market indexes. The weekly survey accounts for more than 40% of all applications processed each week by mortgage lenders.
Visit the Mortgage Bankers Association site at www.mbaa.org.
| MBA Mortgage Applications (3/16/90=100) | 5/30/03 | 5/23/03 | 2002 | 2001 | 2000 |
|---|---|---|---|---|---|
| Total Market Index | 1,856.7 | 1,634.6 | 799.7 | 625.6 | 322.7 |
| Purchase | 460.5 | 395.7 | 354.7 | 304.9 | 302.7 |
| Refinancing | 9,977.8 | 8,840.9 | 3,388.0 | 2,491.0 | 438.8 |
by Tom Moeller June 4, 2003
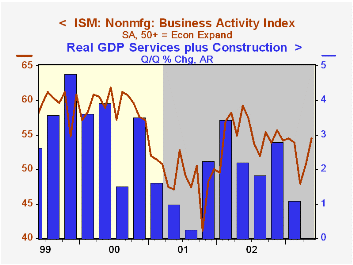
The Institute for Supply Management business activity index of the nonmanufacturing sector rose more than expected last month to 54.5. The Consensus expectation was for a smaller gain to 52.0.
The 3.8 point rise was the second consecutive monthly gain and pulled the index to the highest level since January.
During the last five years, there has been a 69% correlation between the level of the Business Activity Index from the ISM nonmanufacturing survey and quarterly growth in real GDP in the service sector plus structures.
The seasonally adjusted new orders index rose to 54.7, its highest level since January, and the employment index rose to 48.7.Business activity for the nonmanufacturing sector is a question separate from the subgroups mentioned above. In contrast, the NAPM manufacturing sector composite index weights the components.
The seasonally adjusted prices index slumped to 49.6, the first month below 50 since February of last year.
ISM surveys more than 370 purchasing managers in more than 62 industries including construction, law firms, hospitals, government and retailers. The nonmanufacturing survey dates only to July 1997, therefore its seasonal adjustment should be viewed tentatively.
| ISM Nonmanufacturing Survey | May | April | Y/Y | 2002 | 2001 | 2000 |
|---|---|---|---|---|---|---|
| Business Activity Index | 54.5 | 50.7 | 59.2 | 55.1 | 49.0 | 59.3 |
| Prices Index | 49.6 | 56.7 | 53.0 | 53.9 | 51.6 | 63.5 |
by Tom Moeller June 4, 2003
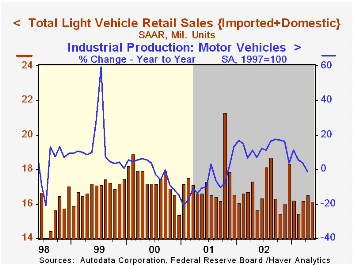
Unit sales of light vehicles fell 2.3% m/m in May to an annual rate of 16.12 million units. Consensus expectations were for sales of 16.3 mil. units.
Sales of cars fell for the fourth month this year, down 3.1%. Truck sales also slipped 1.6% for only the second monthly drop this year.
| Light Vehicle Sales (SAAR, Mil.Units) | May | April | Y/Y | 2002 | 2001 | 2000 |
|---|---|---|---|---|---|---|
| Total | 16.12 | 16.50 | 2.9% | 16.81 | 17.26 | 17.40 |
| Autos | 7.27 | 7.50 | -6.3% | 8.07 | 8.48 | 8.83 |
| Light Trucks | 8.86 | 9.00 | 12.0% | 8.74 | 8.78 | 8.56 |

Tom Moeller
AuthorMore in Author Profile »Prior to joining Haver Analytics in 2000, Mr. Moeller worked as the Economist at Chancellor Capital Management from 1985 to 1999. There, he developed comprehensive economic forecasts and interpreted economic data for equity and fixed income portfolio managers. Also at Chancellor, Mr. Moeller worked as an equity analyst and was responsible for researching and rating companies in the economically sensitive automobile and housing industries for investment in Chancellor’s equity portfolio. Prior to joining Chancellor, Mr. Moeller was an Economist at Citibank from 1979 to 1984. He also analyzed pricing behavior in the metals industry for the Council on Wage and Price Stability in Washington, D.C. In 1999, Mr. Moeller received the award for most accurate forecast from the Forecasters' Club of New York. From 1990 to 1992 he was President of the New York Association for Business Economists. Mr. Moeller earned an M.B.A. in Finance from Fordham University, where he graduated in 1987. He holds a Bachelor of Arts in Economics from George Washington University.
More Economy in Brief


