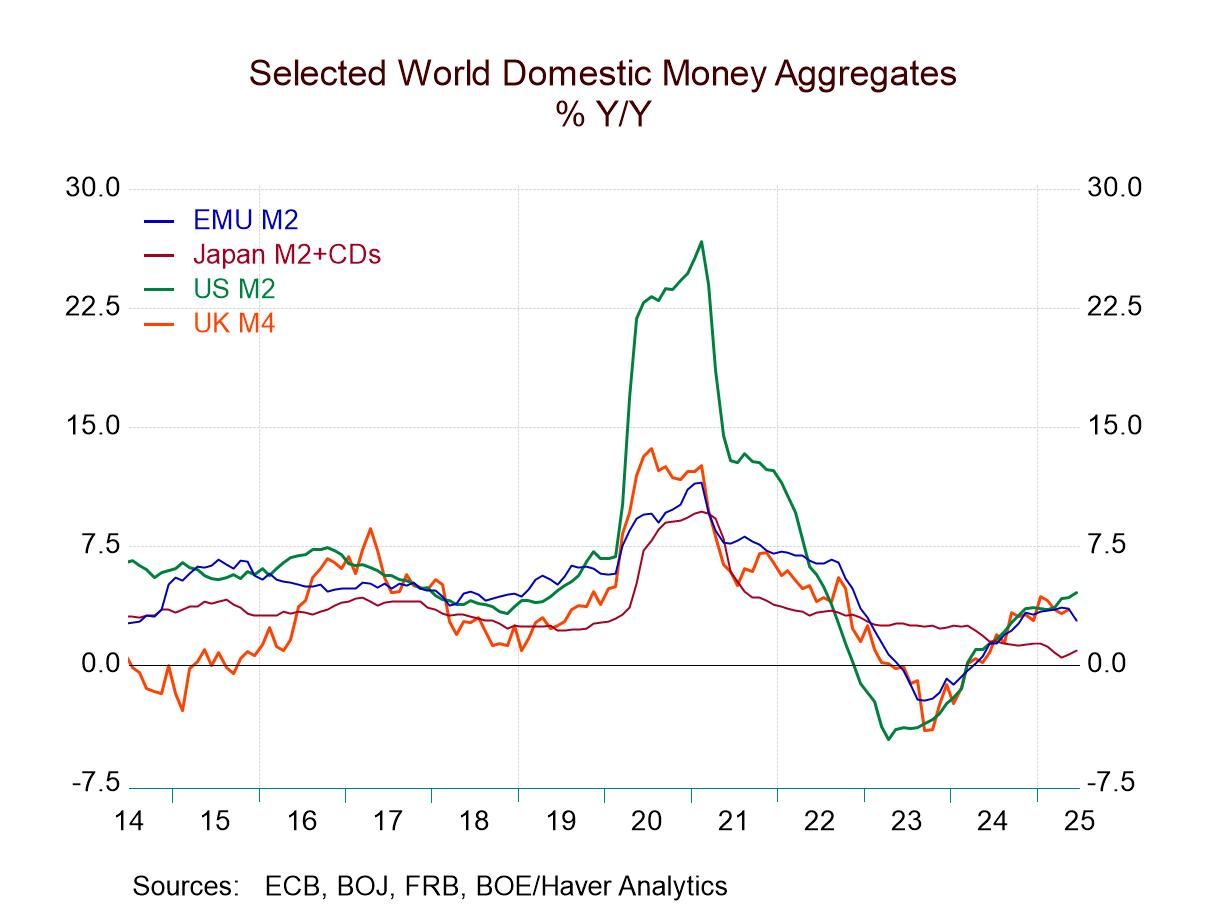
Hypnotists are just trying to get you to focus on something and concentrate on it so that you can relax and they can put you into a hypnotic trance. Right now, you want to make sure that does not happen as you watch what is going on with money supply. It is not ‘entrancing’ and ought to be followed. The chart shows you that trends - and often excesses in ‘global money supply’ growth have begun in that money center country, the United States of America. And… well… here we go again? While it's very early in the game, it looks like, after a period of monetary weakness and re-escalation, U.S. money growth is now beginning to step up in the U.S. Meanwhile, in Europe and in the United Kingdom, money growth, especially real money growth, is beginning to tail off. All this is at a time when Japan's money growth, of course, has been marching to the step of a different drummer showing regular, consistent, nominal weakness and actual declines in the real money stock to try to tame its incipient inflation.
The Policy Zone
We are no longer in the COVID era; or even in the post-COVID era. We are now in the post post-COVID era. And monetary policy is being made based on conditions rather than remedy perceived legacy problems in the economy from COVID. We need to make that transition in our analysis too, and ask ourselves, “What's really happening?” In the U.S., the popular dogma is to claim that central bank independence is being undercut and that Donald Trump's tariffs are going to raise the inflation rate and that the Fed is losing its battle with inflation and inflation is coming because of excessive fiscal policy and the imposition of tariffs. It's a story you can believe if you want to. There's certainly some evidence to support those points; whether they completely justify that point of view, it is still too early to say. However, clearly, money supply growth in the U.S. is ramping up. The U.S. 12-month growth rate is up to 4.5%, over six months the annualized rate hits 5.5%, and over three months the annualized rate hits 6.9%. It's hard to say that that's occurring because of Trump's tariffs. At the same time, the growth rate in real money balances - that's money supply deflated by the CPI - has boosted its growth rate from 1.8% over 12 months to a 2.9% annual rate over six months to a 4.4% annual rate over three months. Is the chase on for an inflation ‘uptick’ that will not be temporary?
Follow the leader, or go your own way?
It will take some time to tell if the other money center countries are going to follow the leader or not. So far it looks like ‘or not.’ Money supply growth in the European Monetary Union (EMU) is actually decelerating slightly from 2.8% over 12 months to a 1.7% pace over six months to a 1.3% pace over three months. Similarly, in the EMU the growth of real balances has slipped from 0.8% over 12 months to a 0.2% annual rate over six months to a -0.6% annual rate (contraction) over three months. So far, euro area money supply is not tagging along with the U.S. trend.
Euro-credit trends
Meanwhile, private credit growth in Europe has stabilized with the 12-month growth rate of 2.3% that moves up to 2.4% over six months and settles back to 2% over three months, a relatively stable performance that would seem to signal ongoing moderate growth. The growth rate of private credit, deflated for the effects of inflation, shows continued growth, and beyond that the trend is unclear. Over 12 months the growth rate is 0.3%, over six months that improves to 0.8%, and over three months it drops back to a 0.1% pace. I'm not good enough at splitting hair to be able to tell you what that trend is.
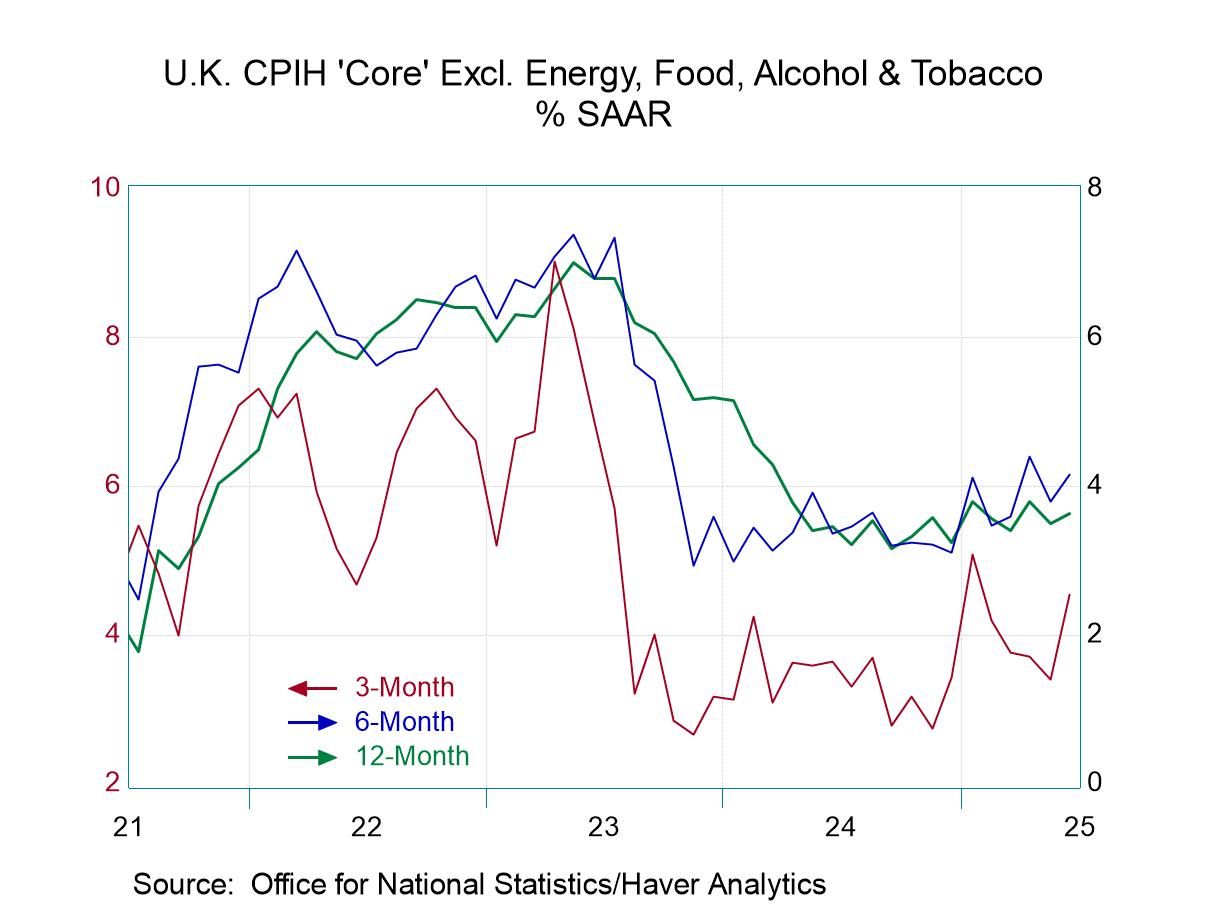
U.K. money weakens
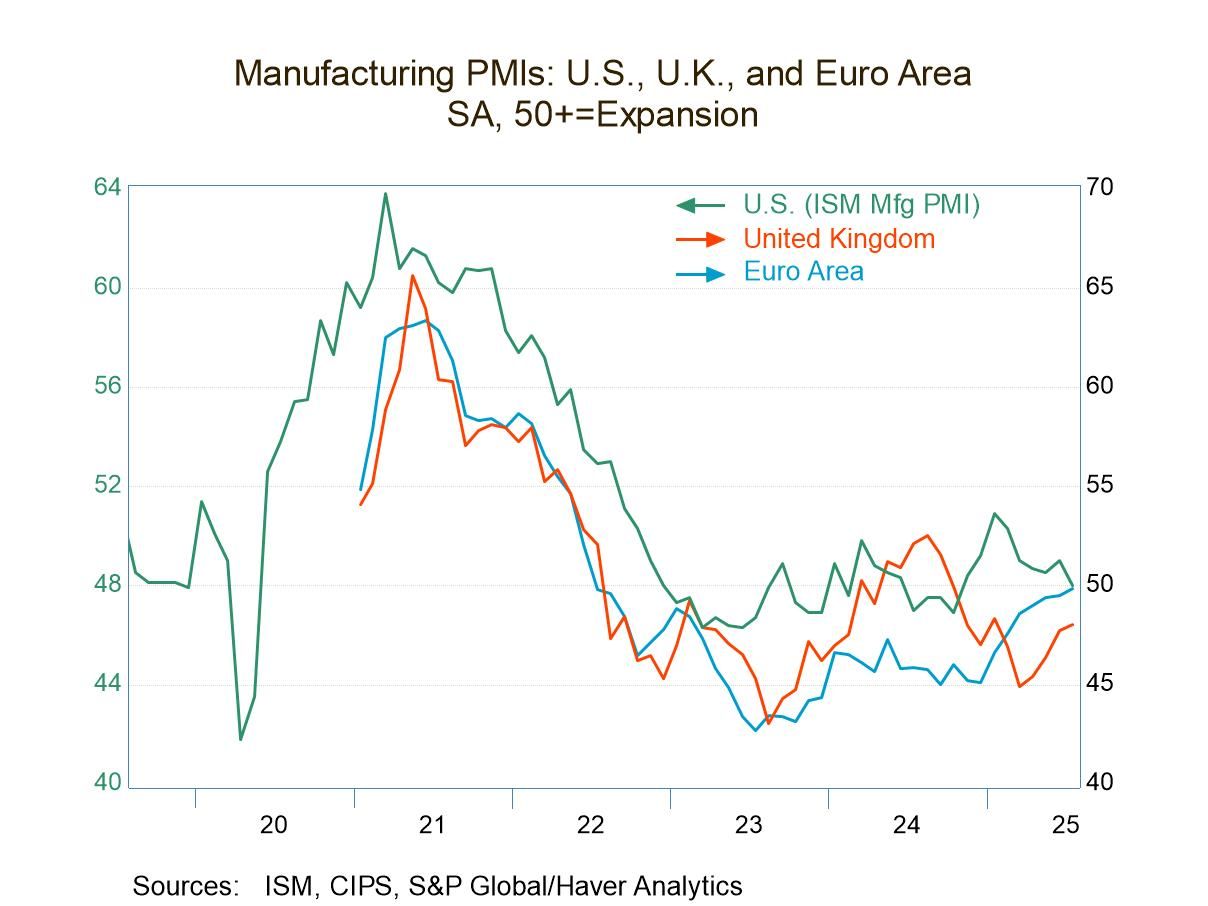
In the U.K., nominal money supply growth seems to be slowing, but that isn't crystal clear, with the 3.5% annual rate over 12 months moving up to a 4.1% annual rate over six months been slipping back to 1.7% over three months. It may take a few months to be able to tell if the step down to 1.7% is real or just volatility averaging out the step up over six months. U.K. money growth does not appear to be excessive or rogue; when we look at real balances, 12-month growth is -0.4%, six-month growth is -0.1% and the three-month growth rate is -1.6%. On that profile, real money growth in the U.K. does not appear to be following the U.S. rule book either.
Japan- dealing with its own complex issues
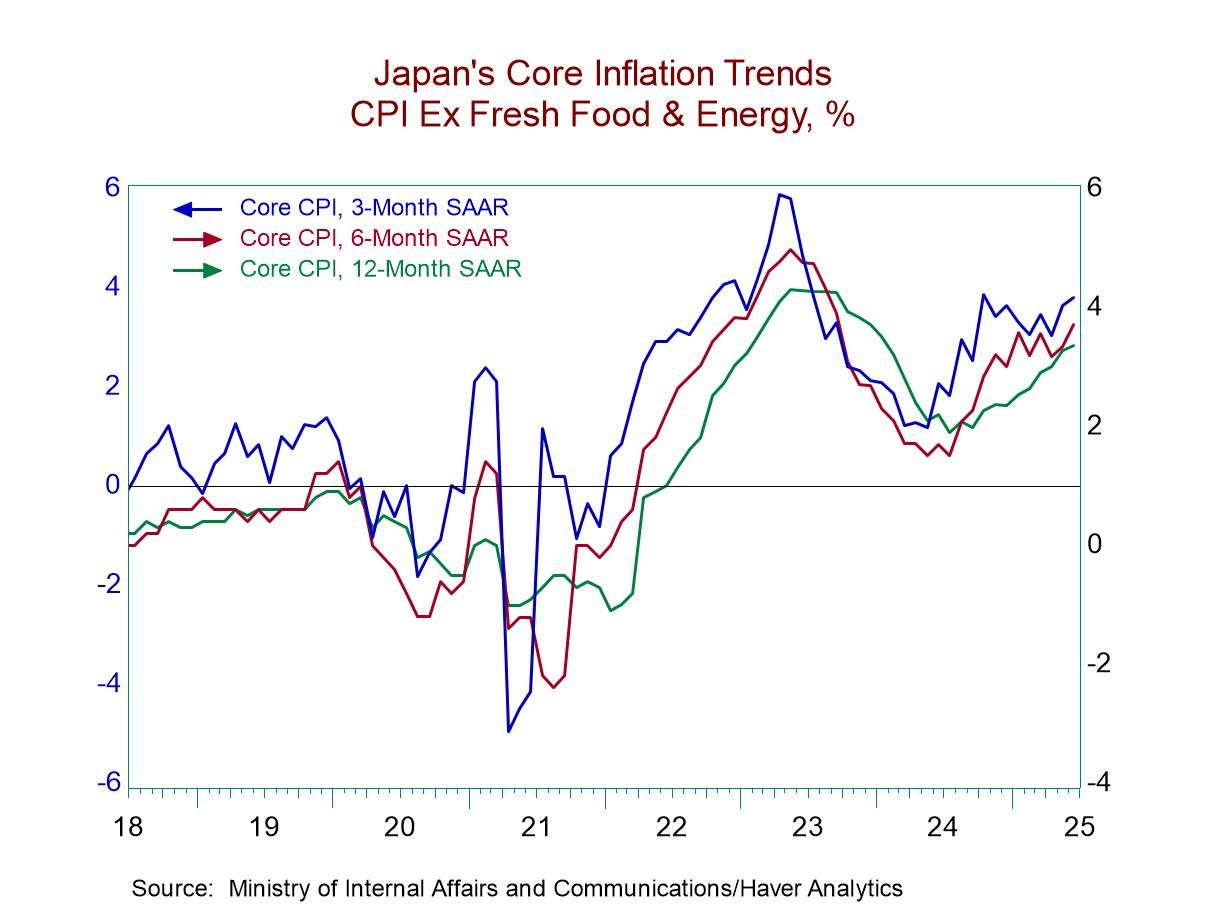
We know that Japan has been off on its own for a while. Japan clearly has been fighting off a bout of inflation. But, since that development is relatively new, and the previous battle with deflation was relatively long-lived, if we think in terms of inflation averaging, Japan is still dealing with an extremely small problem. Despite the appearance of some real inflation (depending on the price index you look at to establish Japanese inflation trends), Japan's inflation overshoot in contexts is only making up for lost time.
Money growth in Japan is 0.9% over 12 months; however, it's only running at a 0.1% annualized over six months and over three months. The growth of real money balances in Japan is negative. Real balance growth rates are negative on balance over three years and two years; the 12-month growth rate for real money balances is -2.3%, over six months it is -2.2%, and over three months it is -2%. The degree of restriction has faded but faded only very marginally. The main point is that in Japan, real money balances are contracting and so there is a fight to reduce inflation going on behind the scenes and that's clearing up; you can see it in the money growth rates on the chart as well if not from the level or real interest rates. Japan is balancing complex needs.

 Global