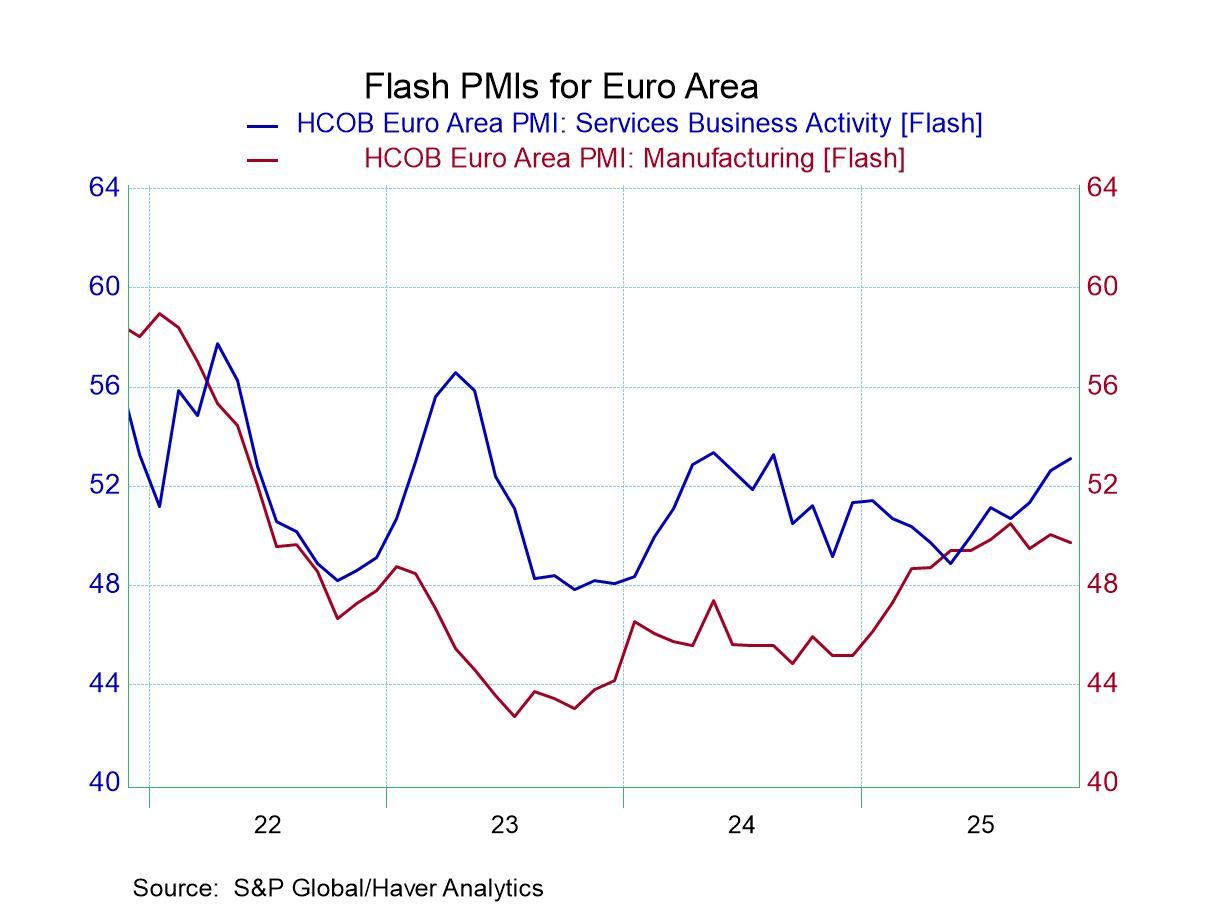
The month-to-month changes in the S&P PMI indices are mixed in November with slightly more of them weakening than strengthening but still quite a significant mix and the European monetary union the composite index weakened, dragged lower by a weakening in manufacturing while the services index improved. The services in EMU improved for three months in a row but manufacturing deteriorated for two months in a row before sinking in November.
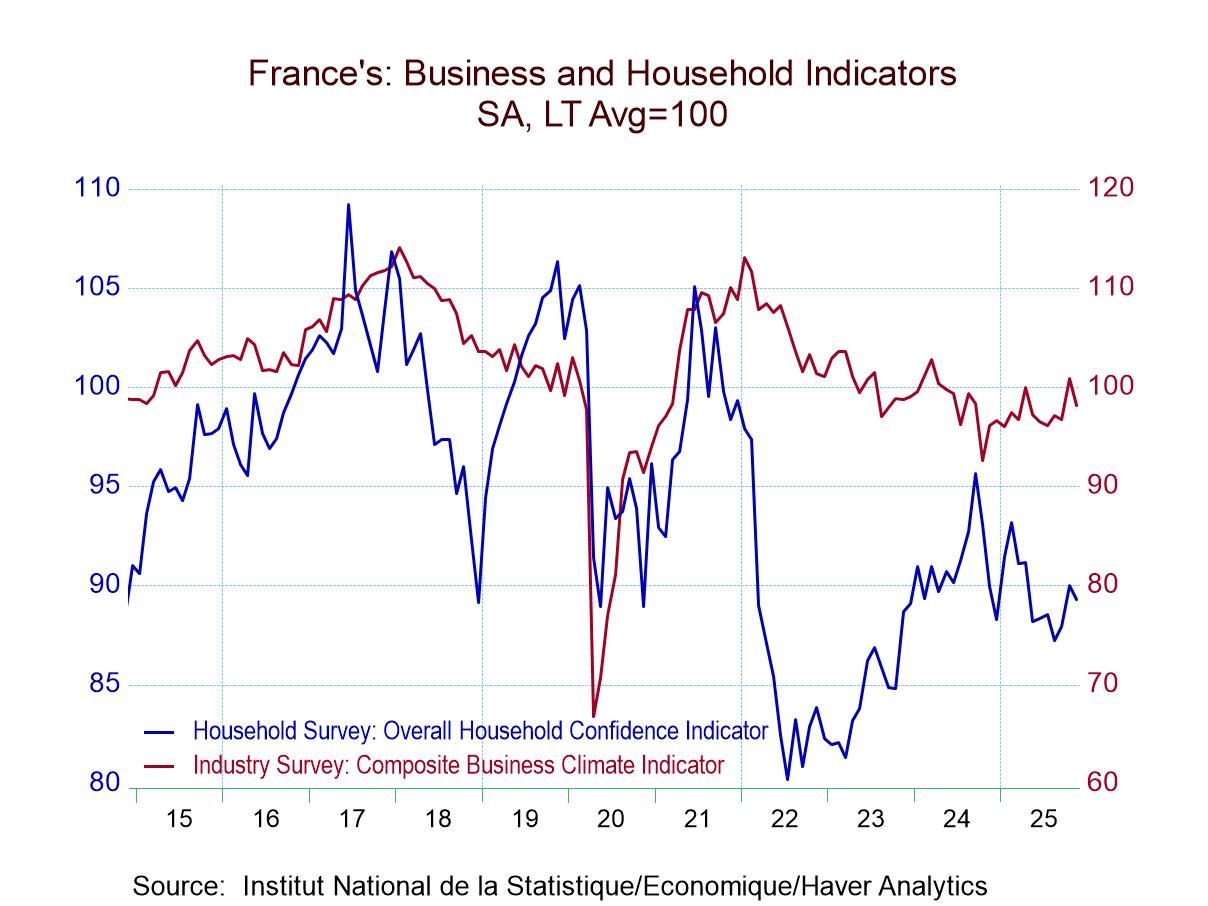
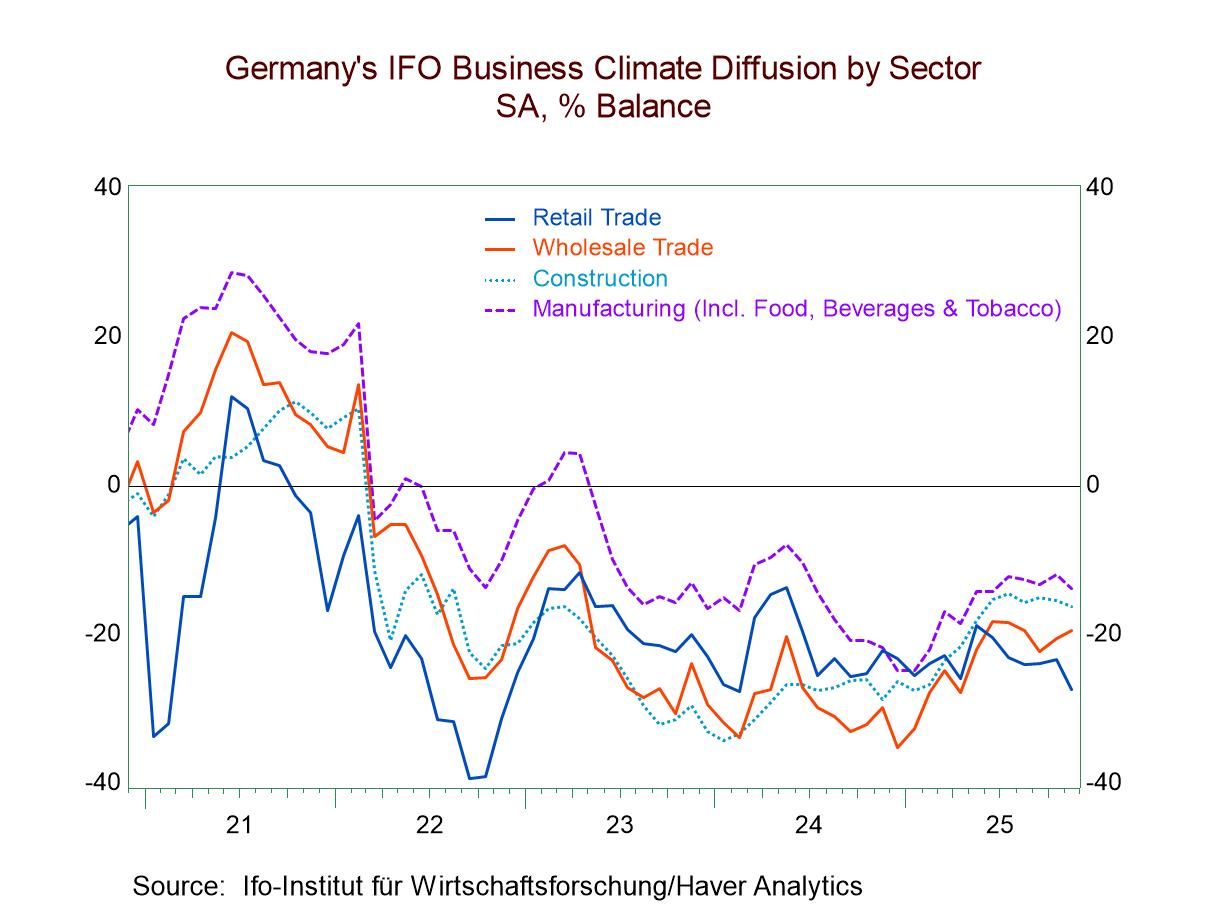
Germany and France separately report early from the monetary union. Germany shows weakening across the board for all three sectors while France shows strengthening in the composite and in services only showing a weakening in manufacturing.
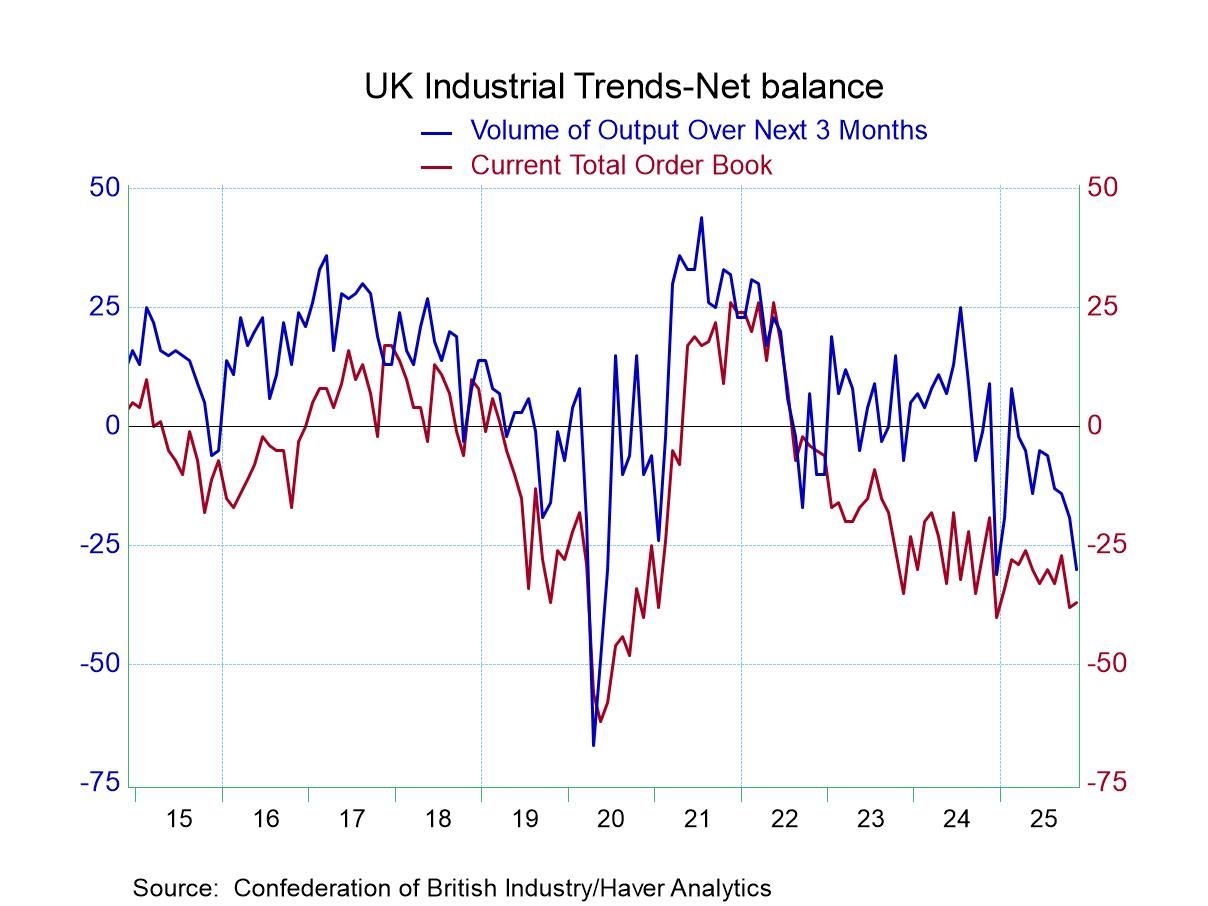
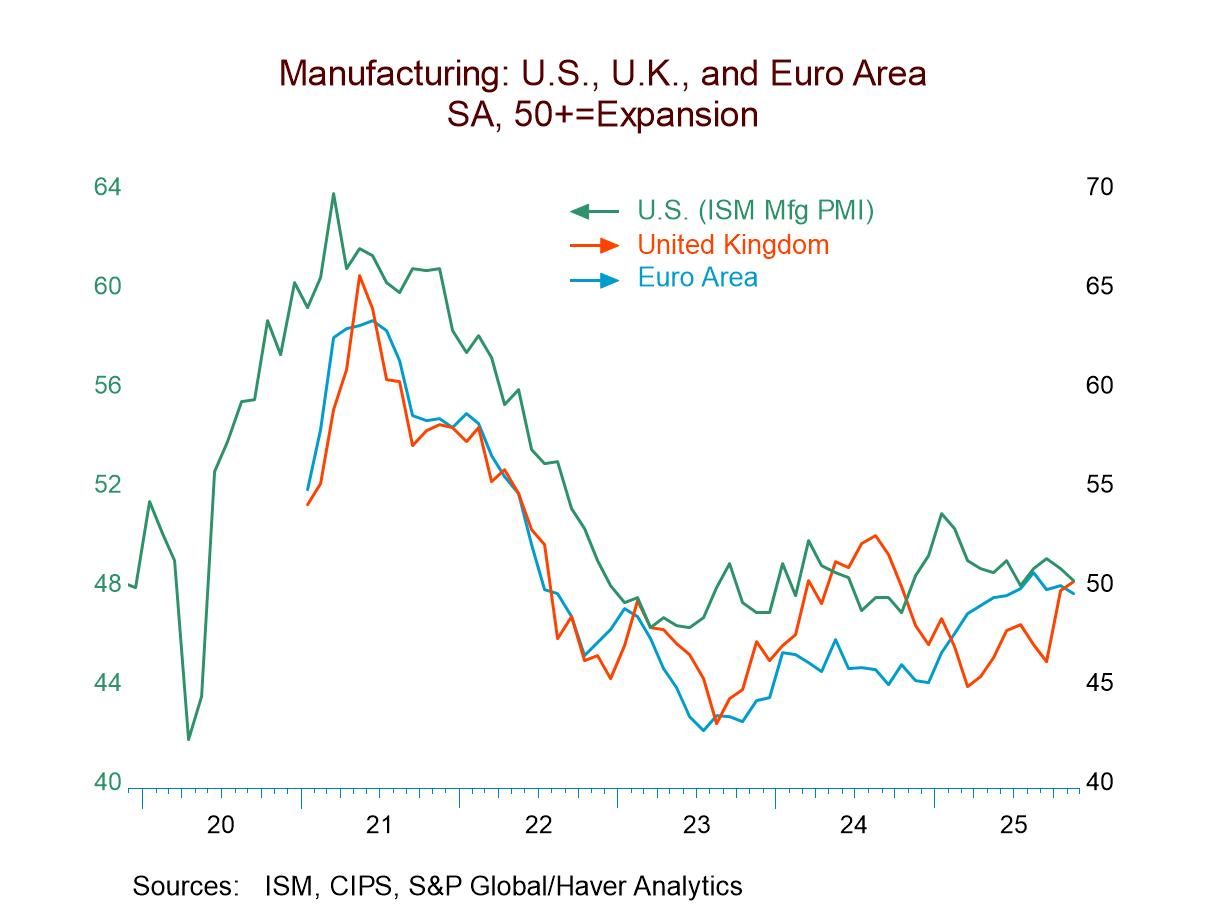
The United Kingdom shows weakening the composite and in services with strengthening in manufacturing. That pattern is repeated in Australia.
Japan shows improvement in all three sectors and shows consecutive improvement only in the composite index.
India shows weakening in the composite and in manufacturing with only services strengthening in November after all three sectors weakened in October.
The US, after seeing all three sectors weaken in September, then strengthen in October, shows the stronger composite and stronger services in November juxtaposed to a weaker manufacturing reading.
The monthly data create a great deal of turbulence and create a picture that's hard to pin down in terms of trends and generalities. However, the three-month, six-month, and 12-month average data provide a much more solid and stronger framework. That sequence is not only stronger but it's much more solid in terms of the message that it sends. The period averages which are calculated only on completed data (so these are data through October) show only three-sectors (out of 24) weakening that's France for the composite, and France for services, and Japan for manufacturing; the other six countries or areas all show sector readings improve for the three-month average compared to the six-month average. Six-month averages compared to 12-month averages show only a weakening in Australia for manufacturing. 12-month averages compared to 12-months ago show weakening in only 8 separate sectors involving five different regions. Year-over-year comparisons show the UK is weaker in all sectors, Japan is weaker for the composite and for services, the European Monetary Union, Germany, and France are weaker on their 12-month average only for the services sector.
Percentile standing
The queue percentile standings for the eight countries in the table reveal readings below the 50% mark for only three of 24 sectors those 3 sectors are the UK composite, UK services, and manufacturing in Japan. All the rest have standings above the 50% mark which puts them above their historic medians on data back to January of 2021.
The standing data are substantially improved from what we're seeing just a few months ago there is a general improvement in the global economy as is clear from the average data although the monthly data are still quite touch and go.
Summing up
The November report is disappointing because prior to its release there had been relatively solid trends in place. It's now going to be important to keep an eye on the monthly data to see if this improving trend remains or if we've entered a period where signals are going to get mixed again. There's some evidence of some scattered weaknesses, particularly in the UK economy, that's performing poorly, there, the central bank is likely to deliver another rate reduction soon. The situation in the European monetary union is much more in flux. The US is also in ‘no-man’s-land’ on jobs and inflation, but in the United States the difference is that GDP growth has been strong and appears to continue to be strong on the back of investment an artificial intelligence and in data centers. The US continues to report out weak job growth, essentially because of special factors related to structural demographic conditions, a closed border, deportations, legacy effects from a closed government, (which have now been reversed) and what may be ongoing weakness caused by a transition from firms that are phasing in their artificial intelligence investment. Every economy has a story. The US story may stave off rate cuts through year-end.

 Global