 Global| Sep 18 2025
Charts of the Week: Faith in the Fed, Faith in Fiber
by:Andrew Cates
|in:Economy in Brief
Summary
Global equity markets have remained near record highs over the past few days following the Fed’s 25bp cut on Wednesday, and which investors have seen as a key prop even without a full dovish pivot. AI optimism is also arguably doing some heavy lifting: markets are pricing a step-change in economy-wide productivity and margins from AI adoption, lifting multiples—especially among AI-exposed companies. However, some of this week’s charts frame the hurdles those hopes must clear: US consumer confidence remains subdued even as equities rise (chart 1); the Fed’s forward path is potentially becoming more politicised and inflation expectations have not softened in line with oil (chart 2); economists’ 2025 profit growth forecasts, in the meantime, have been marked lower and dispersion is wide, leaving valuations reliant on an AI-led earnings re-acceleration (chart 3). Elsewhere in Asia, earlier and ongoing easing underscores weak domestic demand and tariff risks rather than robust momentum (chart 4). Commodity dynamics could help at the margin—food prices have eased on better harvests and smoother supply chains (chart 5). Finally, and ahead of this week’s BoE decision in the UK, elevated services inflation tied to still-lofty pay growth is complicating the scope for further policy easing. In sum, the equity narrative arguably leans heavily on AI delivering tangible, near-term earnings power while policy remains credible and inflation contained; disappointment on any front in other words could challenge today’s valuations.
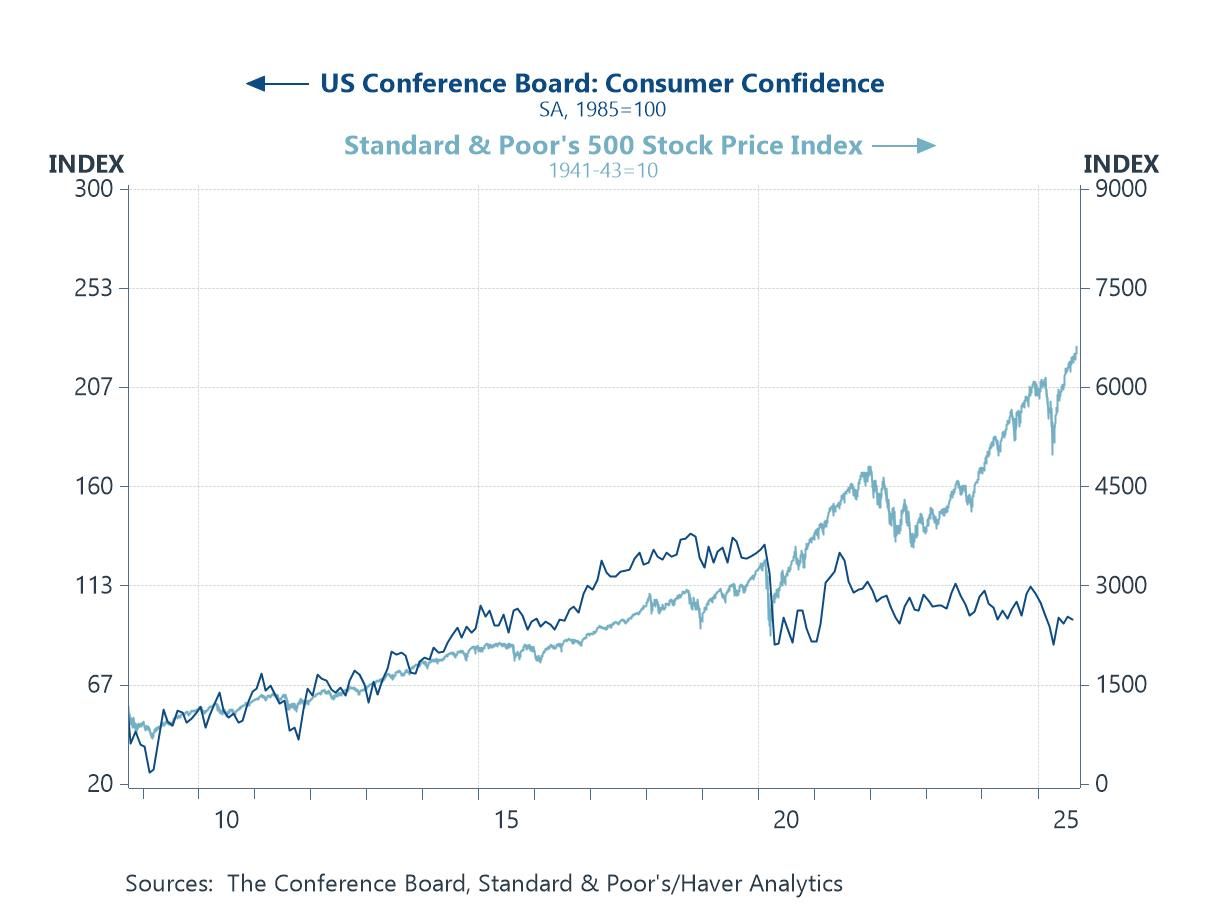
Consumer confidence and equity markets This first chart starkly illustrates a growing disconnect between equity market valuations and underlying economic sentiment. While the S&P 500 has surged to new highs—fuelled in large part by investor enthusiasm for the transformative potential of Artificial Intelligence—the Conference Board’s measure of US consumer confidence has remained unusually subdued. The gap suggests that Wall Street may be pricing in a productivity renaissance that households and consumers have yet to feel in their day-to-day economic realities.
Chart 1: US consumer confidence versus the S&P 500 index
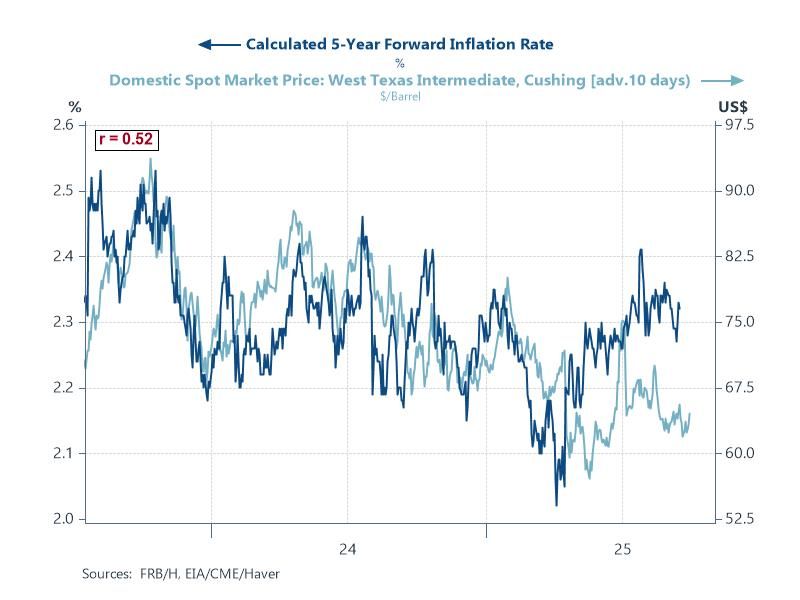
Oil prices and inflation expectations A further prop to risk appetite is the re-emergence of a perceived “Fed put”: investors are betting that prospective Fed easing will cushion growth and keep the expansion alive. The chart, however, flags a complication. Five-year forward inflation expectations have not fallen in line with oil prices, hinting at a decoupling just as the policy path becomes dangerously politicised. Part of the stickiness in expectations likely reflects tariff-related price risks in recent months. If inflation expectations stay firm while oil softens—and politics intrudes on rate-setting—the market’s faith in a smooth, supportive Fed glide-path may prove a shakier foundation than it now appears.
Chart 2: The oil price and market-based inflation expectations
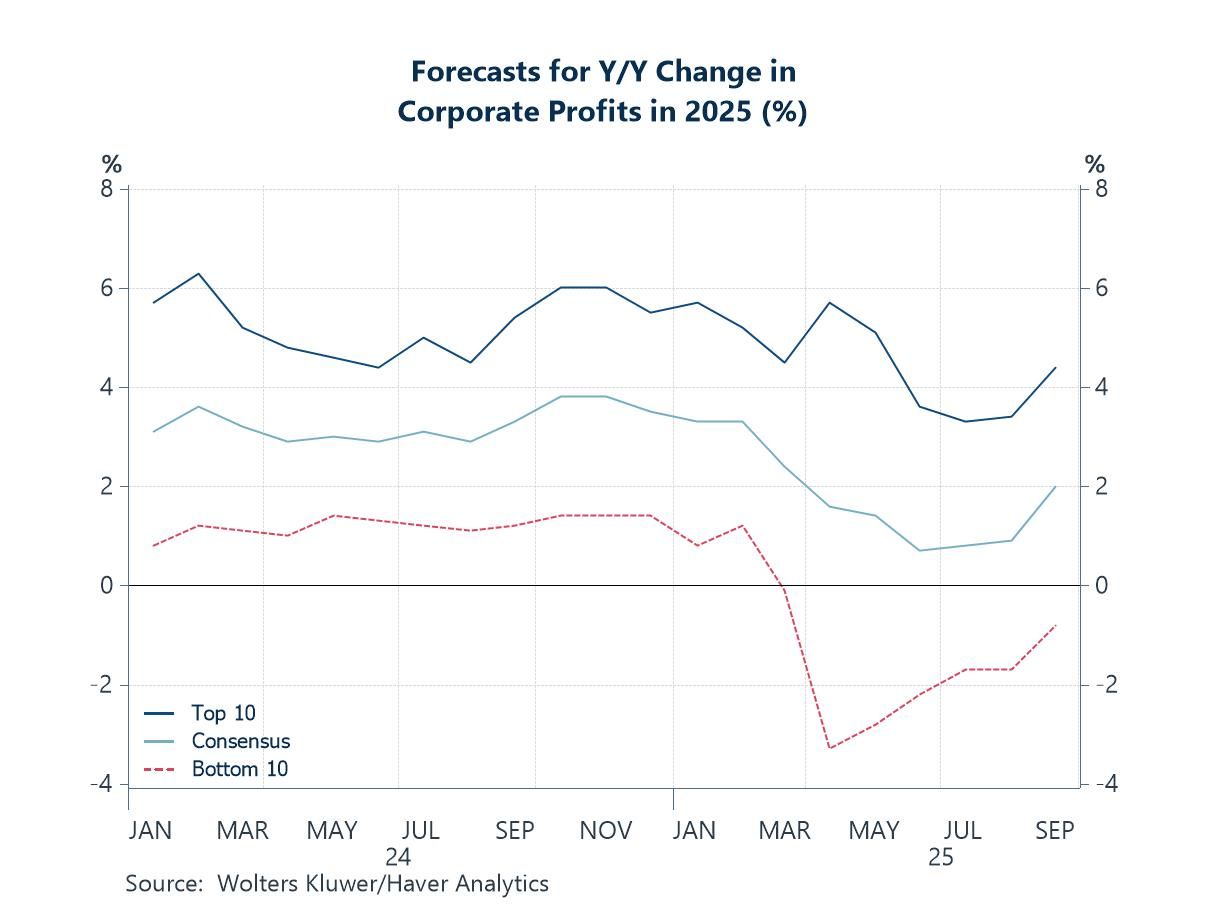
US profitability Ultimately, valuations will live or die by profits. The chart, from the latest Blue Chip Economic Indicators survey, shows US economists steadily marking down their 2025 national‐accounts profit growth forecasts through the first half of this year—consensus sliding from ~3–4% toward ~1% by early summer—before a modest late-summer uptick back toward ~2%. The top-10 forecasters remain more upbeat (~4%+), but the bottom-10 still see outright declines (-1% to -2%), underscoring a wide dispersion of views. If the consensus fails to re-accelerate—and particularly if the bottom tail proves closer to reality—today’s multiple expansion looks vulnerable. A sustained turn higher in these forecasts would help justify equity pricing; until then, profit expectations bear close watching.
Chart 3: The Blue Chip Consensus for US corporate profit growth
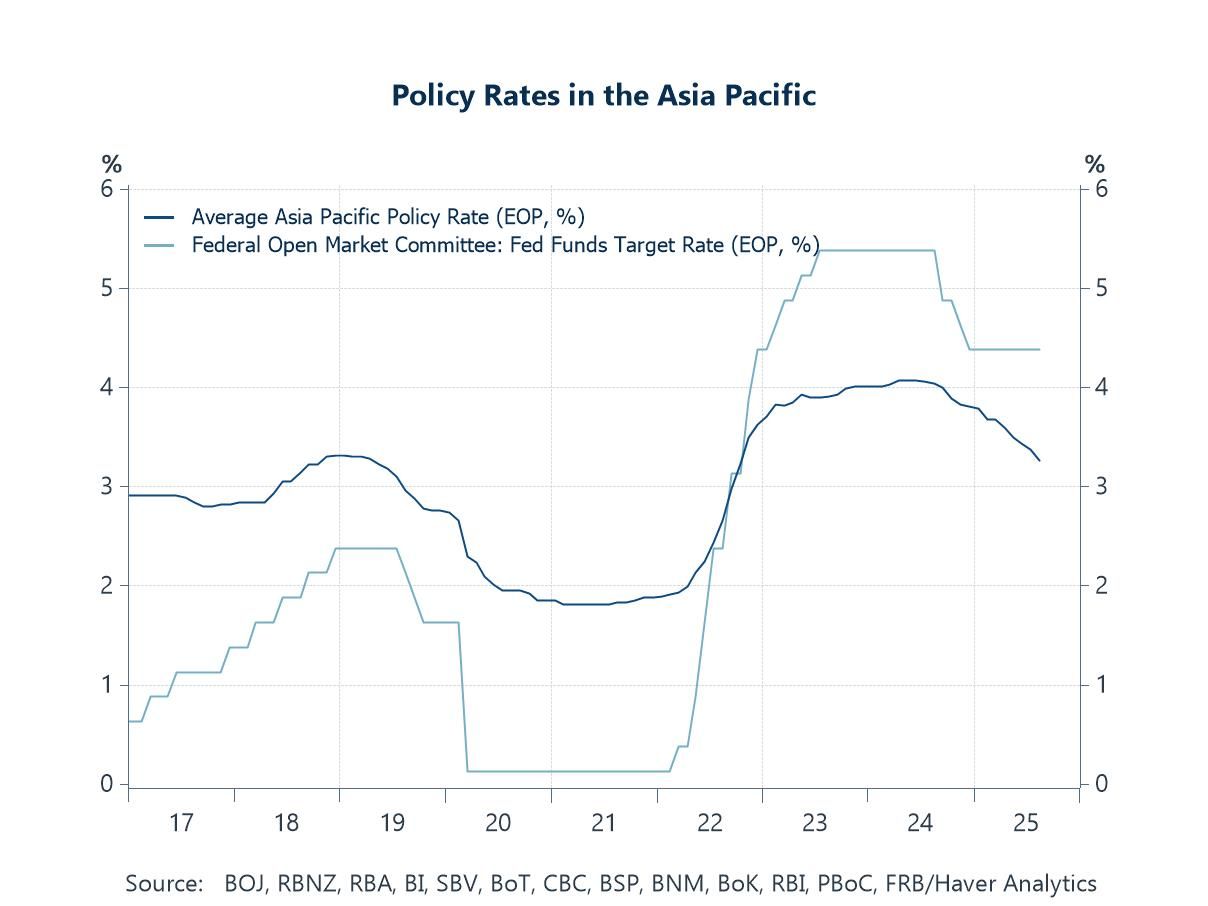
The Fed and Asia’s policy rates With equities potentially leaning on lower discount rates and a perceived policy backstop, the global policy backdrop has admittedly moved in support: the Fed delivered its first 25bp cut of this year this week. In Asia, easing was already underway, with several central banks cutting despite a wider US–Asia rate gap to shore up soft domestic demand and cushion tariff-related trade risks—helped by contained headline CPI in the absence of fresh supply shocks. Further incremental cuts across the region remain plausible, with Japan the notable outlier maintaining a tightening bias. The caveat, as noted above, is that the Fed path is arguably becoming more politicised and tariff pass-through could keep inflation expectations sticky—both limiting how far the easing cycle can run and, by extension, how much policy can underwrite elevated valuations.
Chart 4: The US Fed Funds rate versus Asia’s policy rates
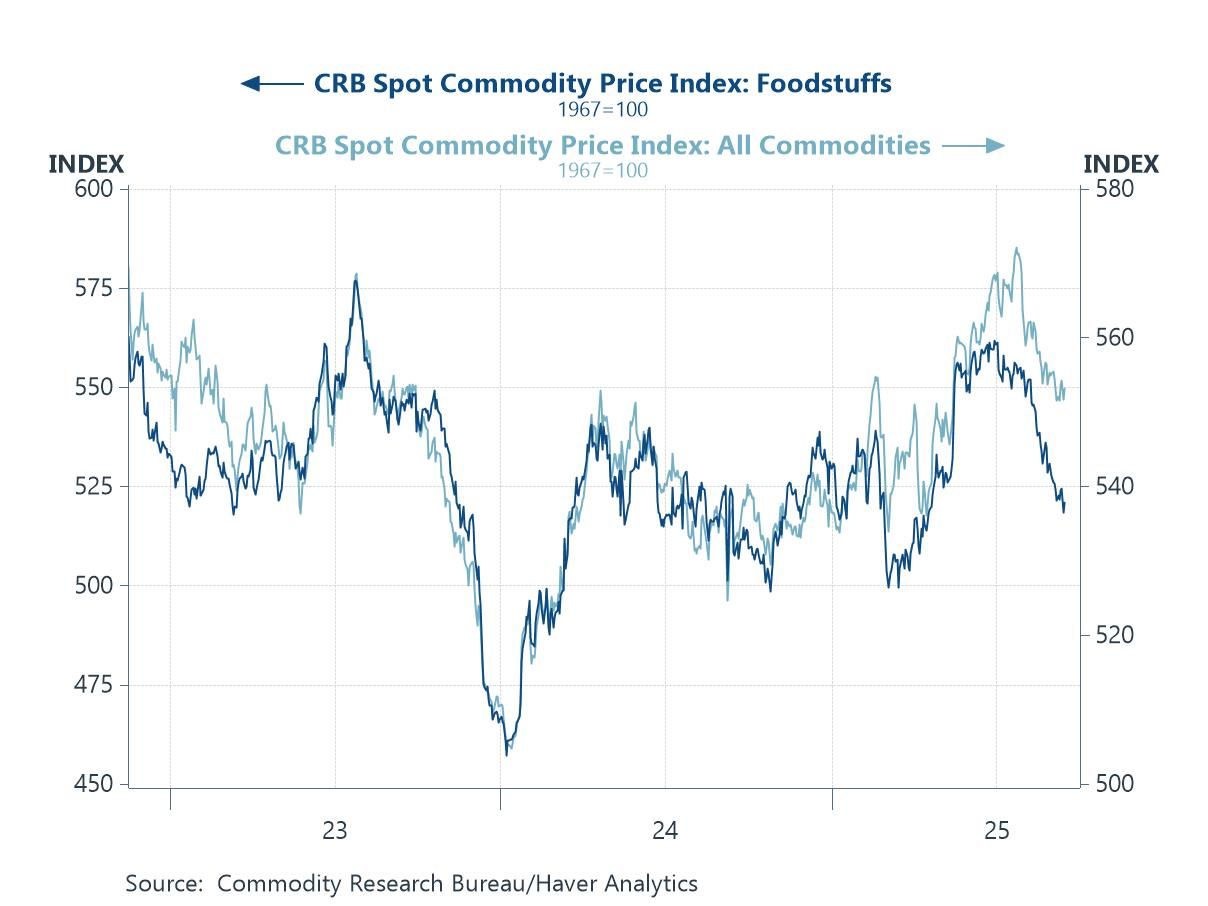
Global food prices Turning to the broader inflation pulse, the commodity tape is doing some of the Fed’s work. The CRB foodstuffs index has rolled over in recent months, trailing the broader CRB basket and signalling softer food-price pressures ahead. Better harvest outcomes and improved supply chains are a big part of the story: higher wheat and coarse-grain yields across key producers (US Plains, Black Sea, parts of Latin America), steadier fertilizer availability and prices versus the 2022 spike, and fewer logistics bottlenecks have lifted exportable supply and eased basis pressures. That should filter into headline CPI with a lag, even if tariffs generate upward pressure in coming weeks. The caveat here is familiar: weather swings and geopolitics can flip this narrative quickly—but for now, the direction of travel in food commodities leans disinflationary.
Chart 5: The CRB Commodity Price Index: Food versus the Total
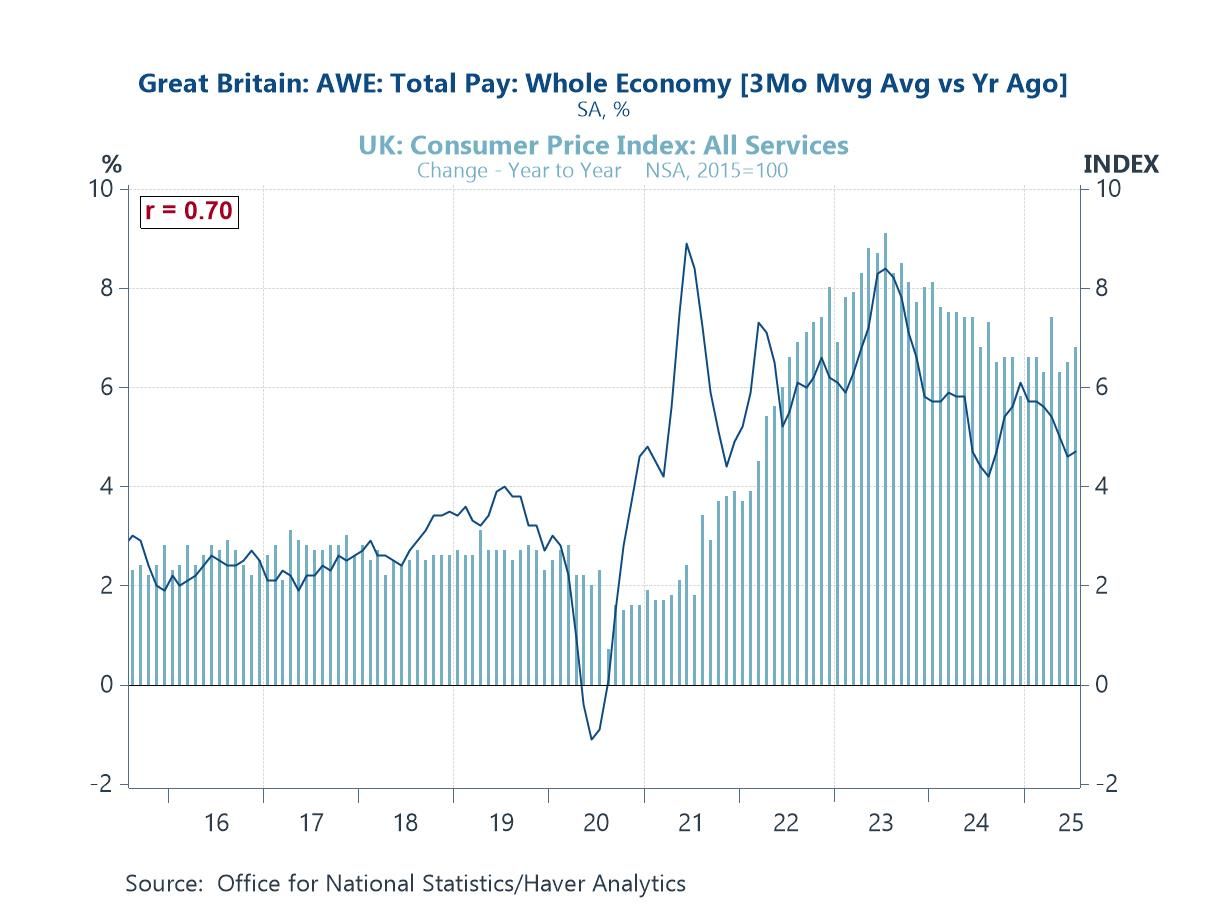
UK inflation Food disinflation ought to help the headline picture in coming months, but the UK’s core pressure point is still services—and that’s mostly about wages. This week’s releases signalled an ebbing labour market and a further nudge down in private sector pay growth. Yet pay is still running at levels inconsistent with a 2% inflation target, and the tight link between pay and services CPI shows why services inflation has ticked the wrong way again (see chart below). That persistence leaves the BoE’s easing path highly conditional: cuts are still possible, but only if wage momentum cools more decisively and the services print follows suit.
Chart 6: The UK: Services CPI inflation versus private sector wage growth

Andrew Cates
AuthorMore in Author Profile »Andy Cates joined Haver Analytics as a Senior Economist in 2020. Andy has more than 25 years of experience forecasting the global economic outlook and in assessing the implications for policy settings and financial markets. He has held various senior positions in London in a number of Investment Banks including as Head of Developed Markets Economics at Nomura and as Chief Eurozone Economist at RBS. These followed a spell of 21 years as Senior International Economist at UBS, 5 of which were spent in Singapore. Prior to his time in financial services Andy was a UK economist at HM Treasury in London holding positions in the domestic forecasting and macroeconomic modelling units. He has a BA in Economics from the University of York and an MSc in Economics and Econometrics from the University of Southampton.
More Economy in Brief


