 Global| May 19 2021
Consumer Price Inflation – It's More Than Used Car Prices
|in:Viewpoints
Summary
In April, the Consumer Price Index (CPI) increased by 0.8% driven, in part, by the 10% (not annualized) increase in the price of used cars and trucks. Although the relative importance of used cars and trucks in the CPI is a low 3%, [...]
In April, the Consumer Price Index (CPI) increased by 0.8% driven, in part, by the 10% (not annualized) increase in the price of used cars and trucks. Although the relative importance of used cars and trucks in the CPI is a low 3%, when there is a very large change in a component with a relatively low weight, this component can have a large effect on the change in the overall CPI. Perhaps, we should have varying “core” CPI concepts depending on what component or components exhibit large month-to-month changes. For example, in April we might look at the CPI excluding used car and truck prices; in May, the core definition might be the CPI excluding gasoline due to the the temporary shutdown of the Colonial Pipeline. If there were only a monthly CPI measure that excluded outsized changes in the prices each month.
Turns out there is. The Cleveland Fed publishes something called the 16% Trimmed-Mean CPI. The 16% Trimmed-Mean CPI eliminates components showing extreme monthly price changes, in this case, 8 percent of the weighted components with the highest and lowest one-month price changes are eliminated and the mean is calculated from the remaining components, making the 16% Trimmed-Mean CPI much less volatile than either the CPI or the core CPI. So, the 16% Trimmed-Mean CPI is less arbitrary than that of the CPI excluding food and energy (the core CPI), which automatically excludes food and energy price from the CPI calculation regardless of the magnitude of these components’ month-to-month changes. A discussion of the origin and rationale for the CPI excluding food and energy will have to wait for another day or author.
Chart 1
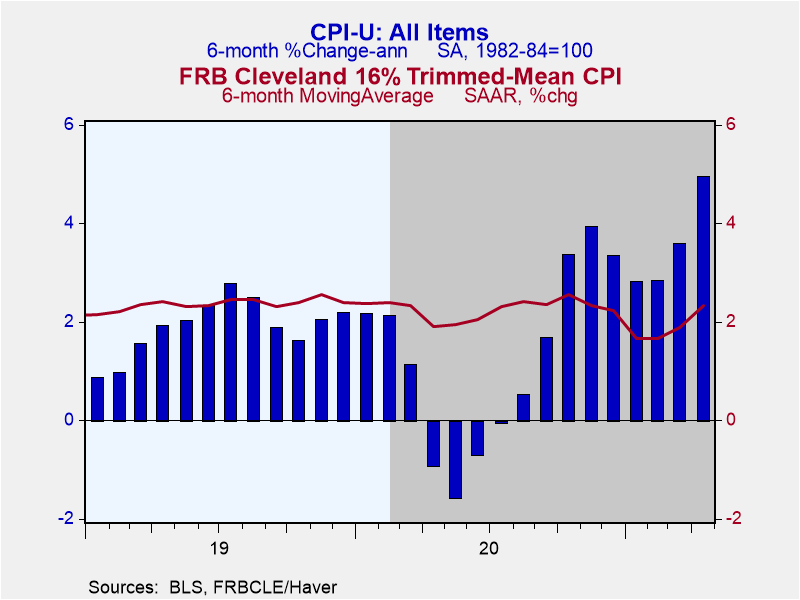
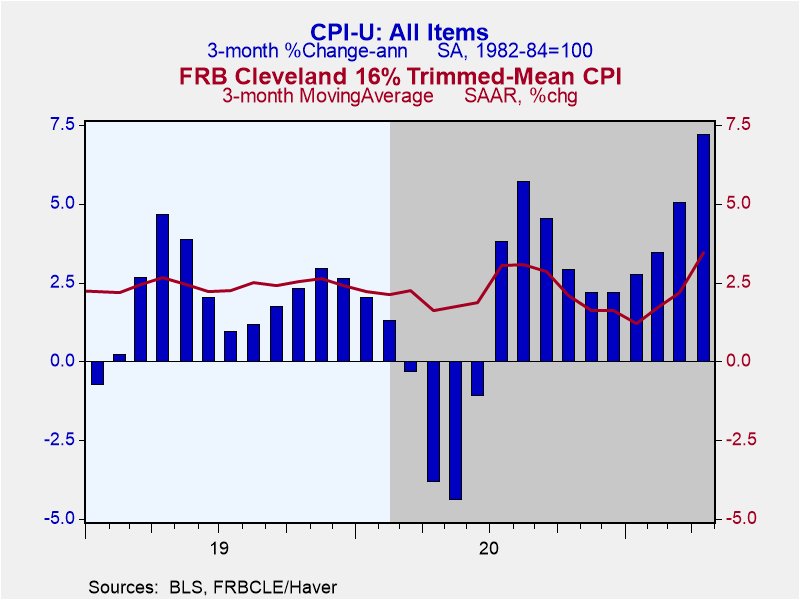
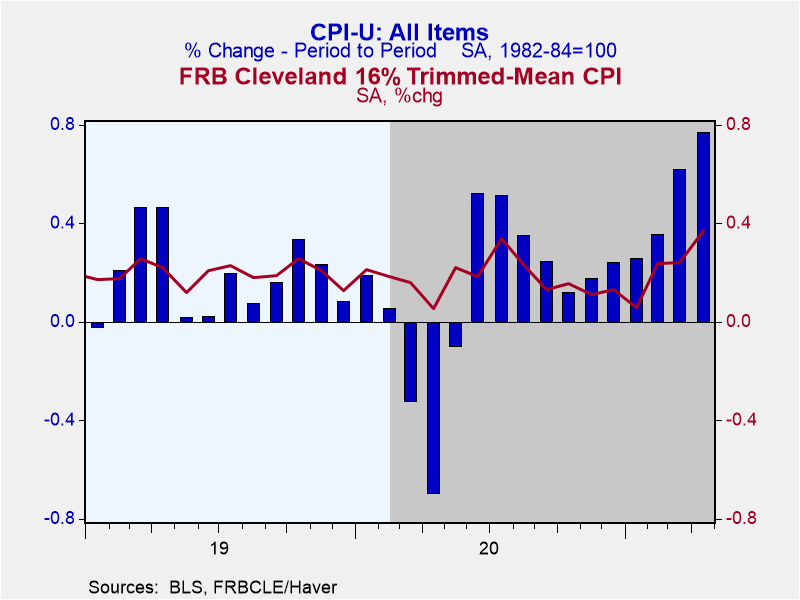
So, let’s take a look at the recent behavior of the 16% Trimmed Mean CPI versus the All-Items CPI. Plotted in Chart 1 are the 6-month averages of the monthly-annualized percent changes in the Trimmed-Mean CPI versus the 6-month annualized percent change in the All-Items CPI. Plotted in Chart 2 are the same variables but with either 3-month averages or 3-month annualized percent changes. Plotted in Chart 3 are month-to-month percent changes in both variables, not annualized.
Chart 2 Chart 3
The 16% Trimmed-Mean CPI lives up to its advertising of showing less variability than the All-Items CPI. You can eyeball this, but the standard deviations (not shown here) of Trimmed-Mean observations are considerably lower than those for the All-Items CPI. The Trimmed-Mean CPI rates of change do not fall as much as those of the All-Items CPI in the early months of the Covid-induced shutdown of economic activity in the spring of 2020. Nor do they rise as much as those of the All-Items CPI as the economy snapped back. But notice, looking at the behavior of the Trimmed-Mean CPI over six-month periods, three-month periods and one-month periods, the rate of inflation has been trending higher starting in the first four months of 2021. It would appear, then, that the underlying rate of consumer price inflation is beginning to move higher. The April readings of the Trimmed-Mean CPI, both over the past three months and month-to-month, show the highest rate of inflation in the period from January 2019 through April 2021. So, it is more than used car and truck prices that has been driving the CPI inflation rate higher in recent months.
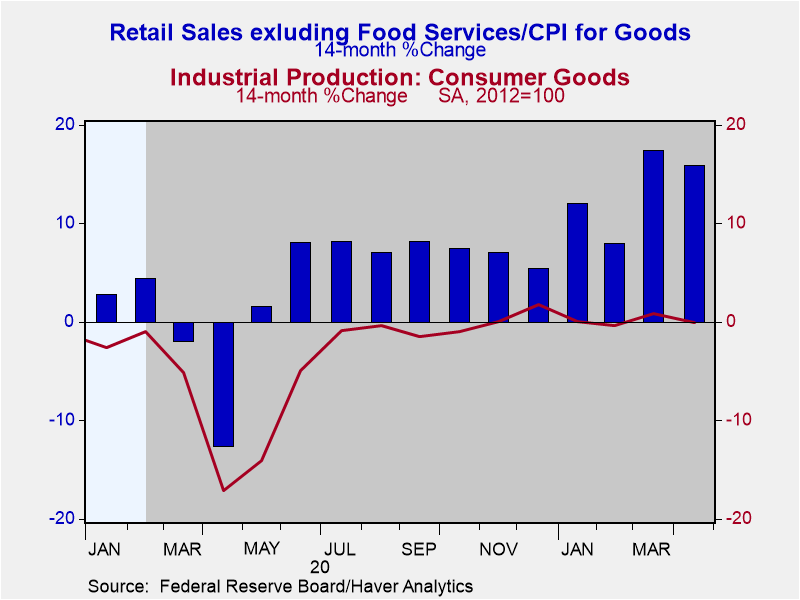
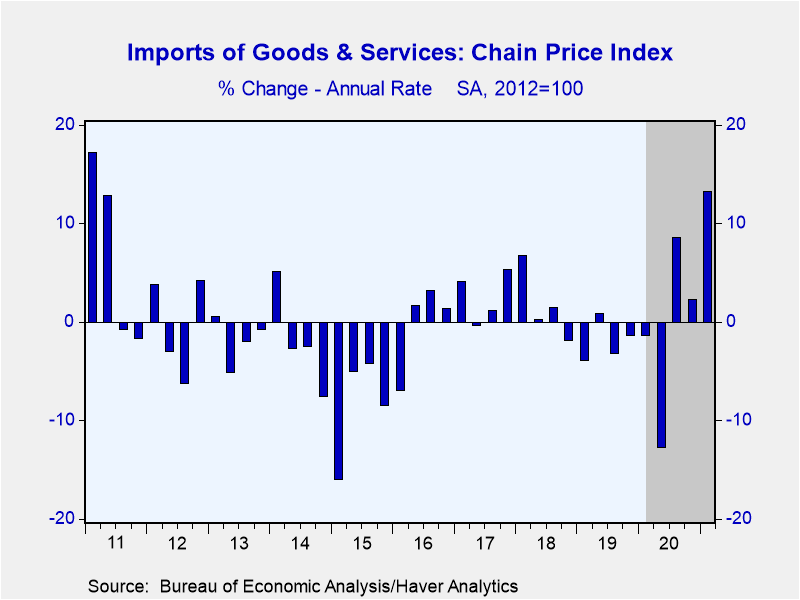
It is no mystery as to why consumer price inflation is starting to trend higher. As my dad used to tell me, demand versus supply. Chart 4 shows that in the 14 months ended April 2021, retail sales, excluding food services, adjusted by the CPI for consumer goods have increased by 15.9% whilst industrial production of consumer goods has increased zero.zero%. So, domestic consumer demand for goods has been outstripping domestic production of these goods. Of course, some of this domestic demand is accommodated by imports. But Chart 5 shows that the prices of imported goods and services are accelerating.
Chart 4 Chart 5
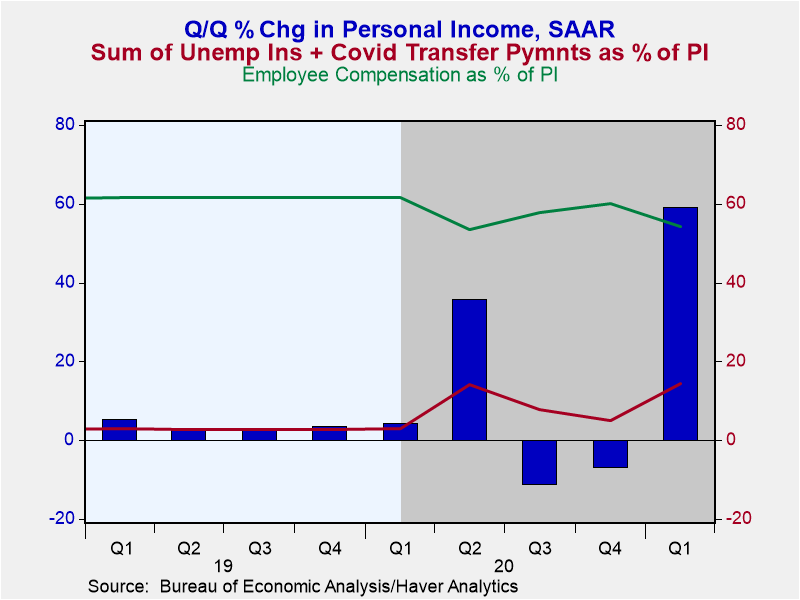
There’s also no mystery as to the source of the surge in consumer demand in recent months and quarters. Personal income has surged in response to more generous unemployment insurance compensation and Covid-related transfer payments to households. Chart 6 shows that the sum of unemployment insurance compensation and Covid-related household transfer payments as a percent of personal income rose from 2.9% in Q1:2020 to 14.5% in Q1:2021. Employee compensation as a percent of personal income fell from 61.6% in Q1:2020 to 54.3% in Q1:2021. The Fed and the commercial banking system financed a large portion of the unemployment compensation and Covid-related transfer payments. In other words, credit was created figuratively out of thin-air to bolster personal income since Q2:2020. More on thin-air credit later in this commentary.
Chart 6
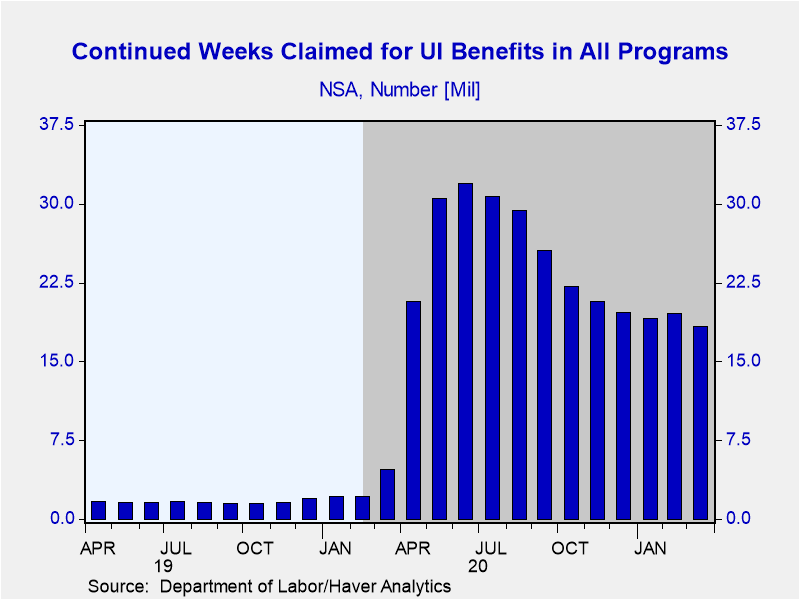
While consumer demand has been growing rapidly in large part due to government transfer programs partially financed by thin-air credit, production of consumer goods and services has been restrained by a shortage of labor and production materials. Although unemployment has come down from the spring of 2020, Chart 7 shows that continuing claims for unemployment insurance compensation remain elevated. With regard to a shortage of materials, microchips come to mind.
Chart 7
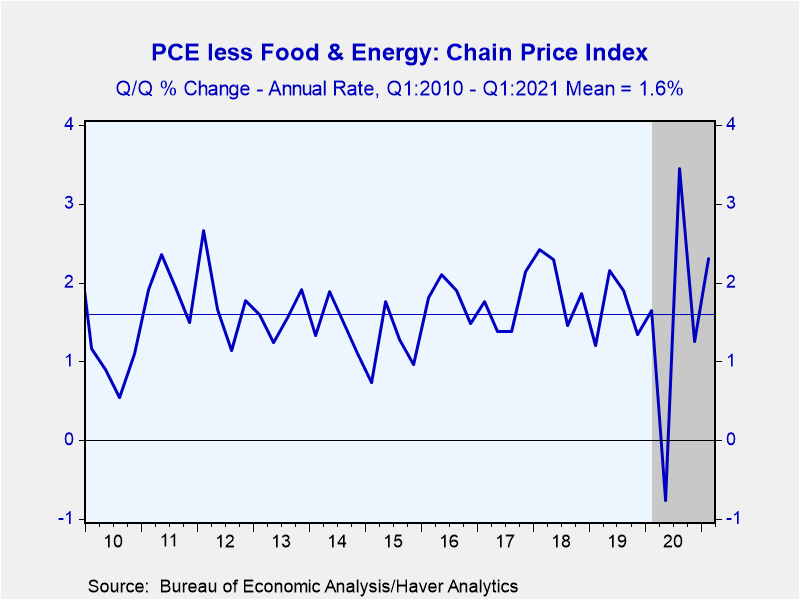
So, we have a mild case of stagflation taking place. Although there are temporary constraints on production, the Fed and the banking system are creating massive amounts of thin-air credit, which is stoking the demand for goods and services (and financial assets, too). The Fed says that it is “looking through” this period of temporary supply constraints. Moreover, because the Fed’s preferred measure of inflation, the Personal Consumption Expenditure (PCE) Chain Price Index, excluding, of course, food and energy prices, has averaged only 1.6% when measured quarter-to-quarter from Q1:2010 through Q1:2021(see Chart 8) compared to the Fed’s target of 2.0%, the Fed is willing to accept some above-target inflation for some undefined period of time.
Chart 8
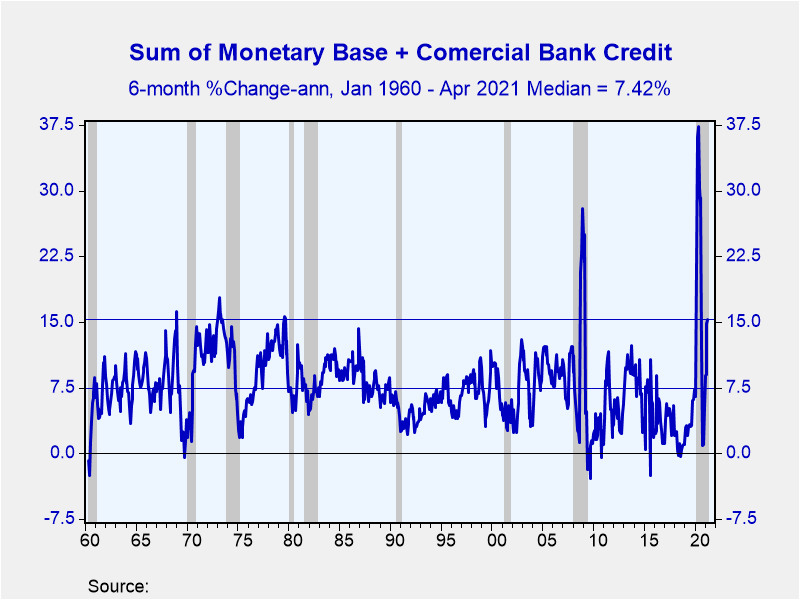
Back in the early and late 1970s the US economy suffered a negative supply shock from a sharp cutback in petroleum output by the OPEC countries. This caused US production of goods and services to contract and the unemployment to rise. Real potential US production fell. At the time, there was much uncertainty as to when OPEC would step up its production again. The Fed, seeing real GDP contract and the unemployment rate rise, adopted a very accommodative monetary policy in terms of thin-air credit creation (see Chart 9) with the “good” intention of trying to cushion the effects of the petroleum shortage on output of goods and services and the labor market. The road to stagflation is paved with good Fed intentions. In the six months ended April 2021, thin-air credit (the sum of the monetary base and commercial bank credit) grew at an annualized pace of 15.30%. From January 1960 through April 2021, the median six-month annualized growth in thin-air credit has been 7.42%. Excepting for the introduction of QE in 2008 and 2020, the latest thin-air credit six-month annualized growth rate of 15.30% is the highest since the 1970s.
Chart 9
With Treasury budget deficits expected to remain high in the foreseeable future and with the private economy expected to continue to expand as constraints of Covid wane, the demand for credit will likely grow faster. As of the March 2021 FOMC meeting, the median of members’ expectations of their target federal funds rate was 0.1% through the end of 2023. A rising demand for credit in the face of a pegged federal funds rate of 0.1% implies faster growth in already rapid thin-air credit growth. Fed policy expectations can change as rapidly as the weather in Chicago, or Sturgeon Bay, for that matter. I believe that the Fed will start to raise the federal funds rate and “taper” its securities purchases by this time next year. Why? Because consumer price inflation will be higher than its 2% target on a sustained basis.
Viewpoint commentaries are the opinions of the author and do not reflect the views of Haver Analytics.Paul L. Kasriel
AuthorMore in Author Profile »Mr. Kasriel is founder of Econtrarian, LLC, an economic-analysis consulting firm. Paul’s economic commentaries can be read on his blog, The Econtrarian. After 25 years of employment at The Northern Trust Company of Chicago, Paul retired from the chief economist position at the end of April 2012. Prior to joining The Northern Trust Company in August 1986, Paul was on the official staff of the Federal Reserve Bank of Chicago in the economic research department. Paul is a recipient of the annual Lawrence R. Klein award for the most accurate economic forecast over a four-year period among the approximately 50 participants in the Blue Chip Economic Indicators forecast survey. In January 2009, both The Wall Street Journal and Forbes cited Paul as one of the few economists who identified early on the formation of the housing bubble and the economic and financial market havoc that would ensue after the bubble inevitably burst. Under Paul’s leadership, The Northern Trust’s economic website was ranked in the top ten “most interesting” by The Wall Street Journal. Paul is the co-author of a book entitled Seven Indicators That Move Markets (McGraw-Hill, 2002). Paul resides on the beautiful peninsula of Door County, Wisconsin where he sails his salty 1967 Pearson Commander 26, sings in a community choir and struggles to learn how to play the bass guitar (actually the bass ukulele). Paul can be contacted by email at econtrarian@gmail.com or by telephone at 1-920-559-0375.


