 Global| Nov 27 2006
World's Output Gains Lift Commodity Prices
by:Tom Moeller
|in:Economy in Brief
Summary
Though a very recent slowdown in industrial output growth in the United States has garnered attention, compared to last year the nation's factories still are humming. That continued growth compares to an advance in factory sector [...]
Though a very recent slowdown in industrial output growth in the United States has garnered attention, compared to last year the nation's factories still are humming. That continued growth compares to an advance in factory sector activity elsewhere in the industrial world which has been firm.
Add to the mix the growth in China and the demand for raw materials has been firm, though the falloff in petroleum prices recently has dominated the headlines. Since 1980, there has been a 60% correlation between the y/y change in prices for industrial materials prices and the change in OECD Big 7 factory production.
Even with oil, the JoC-ECRIindex of industrial commodity prices has registered a volatile sideways drift during since mid-year. That's an impressive performance given the nearly one quarter decline in the price of petroleum products.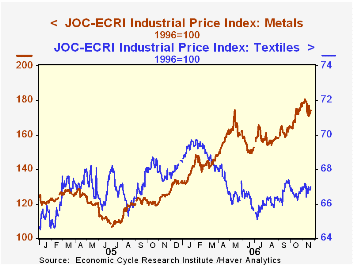
Higher industrial metal prices reflect the world's resilient factory sector (see table above). The JoC-ECRI Industrial Metals Prices Index is up by more than one third from last year on the strength of a 70% y/y advance in copper scrap prices which are roughly double what they were in 2005 and firmness in zinc prices which have roughly tripled since 2005. Additional strength stems from spot aluminum ingot prices (27% y/y) though prices for stainless steel scrap have been flat to down (-15 y/y) with the weakness in auto production which is off by roughly one quarter since early 2002.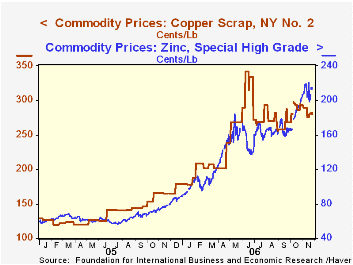
Textile prices certainly are lower than the peak levels of earlier this year. Much of that decline reflects a recent weakness in cotton prices (-6% y/y) though both the JoC index of textile prices and cotton prices in particular have shown recent gain.
Natural gas prices have ranged widely since last winter's spike. A recent lift has taken gas up sharply from the recent low (-33.2% y/y) early this past October. While weather forecasts account for the bulk of the short term movement in gas prices, industrial demand is estimated to account for 37.6% of natural gas demand which is the highest of any sector. A report from the Natural Gas Supply Association is available here.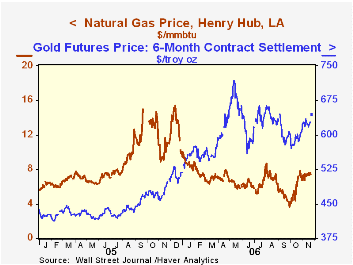
Gold prices as well have shown some lift to $645 per ounce, a rise of roughly one quarter since last year. The Unreliability of Inflation Indicators is a 2000 article from the Federal Reserve Bank of New York and it can be found here.
Inflation, Inflation Expectations, and Monetary Policy, a speech by Sandra Pianalto, President & CEO of the Federal Reserve Bank of Cleveland can be found here.
| Industrial Production (Y/Y %) | 2005 | 2006 (YTD) |
|---|---|---|
| OECD Major 7 Countries | 1.9% | 3.6% |
| United States | 3.2% | 5.2% |
| Germany | 3.4% | 6.4% |
| Japan | 1.6% | 5.0% |
| China | -0.3% | 1.3% |
| Weekly Prices | 11/17/06 | 12/27/05 | Y/Y | 2005 | 2004 | 2003 |
|---|---|---|---|---|---|---|
| JoC Industrial Price Index - All Items | 126.34 | 117.73 | 8.4% | 114.19 | 112.78 | 91.97 |
| Metals | 174.62 | 132.45 | 39.8% | 121.30 | 118.15 | 84.56 |
by Louise Curley November 27, 2006
Although we generally comment on the current day's data releases, occasionally we comment on previously released data if that data were released on a U. S. holiday. Such is the case this year when data on the German Gross Domestic Product for the third quarter and the IFO release for November were released on the U. S. Thanksgiving Day holiday, last Thursday.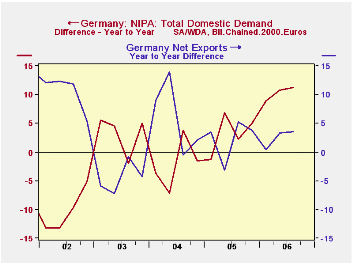
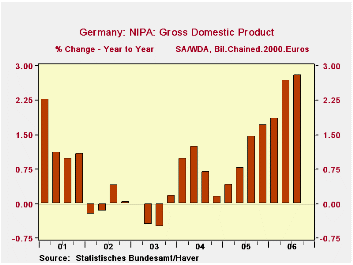
The German Gross Domestic Product increased at an annual rate of 2.6% in the third quarter. Although this was less than the second quarter advance of 4.4%, the year over year increases show an increasing trend during the year. So far this year, GDP has averaged 2.5% above the average of the first three quarters of 2005 With the year over year growth rate increasing it is likely that growth in all of 2006 could be 2.5% or better, well above the poor growth of the last five years, as shown in the first chart Growth has been generated more by activity in the domestic economy than in the foreign sector. The second chart compares the year to year increase in domestic demand with the increase in net exports. So far this year the increases in domestic demand have been well above those in net exports. Consumer demand has probably been influenced recently by purchases in anticipation of the increased in VAT scheduled to come into effect on January 1, 2007, but expenditures on fixed investment have also been strong.
The 7000 manufacturing, construction, wholesale and retail trade firms that participate in the IFO survey of business conditions have become more optimistic regarding their current condition and their outlook for six months ahead. The overall appraisal or headline series rose 1.4% in November and was 9.3% above November, 2005. Confidence in conditions six months ahead began to decline early this year and continued to do so until October when it rose 0.3%. It has risen a further 0.9% in November. Confidence in current conditions faltered in August and September, but has improved in October and again in November.The indexes of confidence in current and expected conditions are shown in the third chart.
| GERMANY | Q3 06 Y/Y % |
Q2 06 Y/Y % |
Q 1 06 Y/Y % |
2005 | 2004 | 2003 | 2002 | 2001 |
|---|---|---|---|---|---|---|---|---|
| GDP (Bil 2000 Chained Euros) | 2.81 | 2.68 | 1.86 | 1.09 | 0.77 | -0.25 | 0.01 | 1.36 |
| Increase in Domestic Demand (Bil 2000 Chained Euros) | 11.25 | 10.69 | 8.88 | 0.64 | -0.42 | 0.66 | -2.01 | -0.40 |
| Increase in Net Exports (Bil 2000 Chained Euros) | 3.55 | 3.35 | 0.46 | 9.43 | 24.55 | -18.33 | 41.58 | 36.28 |
| IFO Index (2000=100) | Nov 06 | Oct 06 | Nov 05 | M/M % chg |
Y/Y % chg |
2005 | 2004 | 2003 |
| Headline | 106.8 | 105.3 | 97.7 | 1.42 | 9.31 | 95.5 | 95.5 | 91.8 |
| Current Conditions | 113.9 | 111.9 | 97.0 | 1.79 | 17.42 | 94.7 | 93.1 | 88.1 |
| Conditions Next 6 Mos. | 100.1 | 99.2 | 98.4 | 0.91 | 1.73 | 96.3 | 97.8 | 95.6 |

Tom Moeller
AuthorMore in Author Profile »Prior to joining Haver Analytics in 2000, Mr. Moeller worked as the Economist at Chancellor Capital Management from 1985 to 1999. There, he developed comprehensive economic forecasts and interpreted economic data for equity and fixed income portfolio managers. Also at Chancellor, Mr. Moeller worked as an equity analyst and was responsible for researching and rating companies in the economically sensitive automobile and housing industries for investment in Chancellor’s equity portfolio. Prior to joining Chancellor, Mr. Moeller was an Economist at Citibank from 1979 to 1984. He also analyzed pricing behavior in the metals industry for the Council on Wage and Price Stability in Washington, D.C. In 1999, Mr. Moeller received the award for most accurate forecast from the Forecasters' Club of New York. From 1990 to 1992 he was President of the New York Association for Business Economists. Mr. Moeller earned an M.B.A. in Finance from Fordham University, where he graduated in 1987. He holds a Bachelor of Arts in Economics from George Washington University.
More Economy in Brief


