Global| Oct 06 2009
Weekly Gasoline Prices Fall ToLowest Level In One Month
by:Tom Moeller
|in:Economy in Brief
Summary
The pump price for regular gasoline fell last week to the lowest level since late-July. At an average $2.50 per gallon the price dropped a nickel from the prior week and may have broken out of the sideways pattern since early-June. [...]
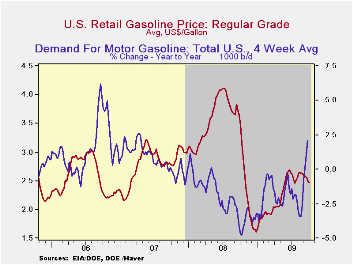
The pump price for regular gasoline fell last week to the lowest level since late-July. At an average $2.50 per gallon the price dropped a nickel from the prior week and may have broken out of the sideways pattern since early-June. These prices compare to the December low of $1.61. Yesterday, prices fell further. The wholesale gasoline price was down to $1.65 per gallon. Prices had reached a high in early-August of $2.03. The figures are reported by the U.S. Department of Energy and can be found in Haver's WEEKLY & DAILY databases.
During August, the consumer price index for gasoline recouped the July decline with a not seasonally adjusted 3.3% increase. Seasonally adjusted gas prices were quite firm and rose 9.1% m/m, up 40.3% YTD.
Crude oil prices have led the decline in
refined product prices. Light sweet crude oil prices (WTI) fell to
$68.41 per barrel, though that still was up from the December low of
$32.37. Yesterday, the spot market price for light sweet crude oil fell
further to $66.84 per barrel versus a daily high of $71.55 last week.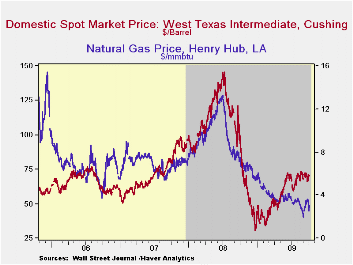
The demand for gasoline continued to improve through mid-month. The y/y rise of 1.1% was the first meaningful positive comparison since early-2007. Demand for residual fuel oil slacked off from its earlier strength and fell 5.1% y/y while distillate demand is off 13.2% y/y. Finally, oil remains plentiful as evidenced by a 16.5% y/y rise in inventories of crude oil & petroleum products. Inventories of gasoline recently have surged and are up 19.2% versus last year. The figures on crude oil production and inventories are available in Haver's OILWKLY database.
Natural gas prices increased again last week to an average of $3.48 per mmbtu (-54.9% y/y) but they remained down by three-quarters from the high reached in early-July of last year of $13.19/mmbtu. Yesterday prices were up from last week's level at $3.54/mmbtu.
| Weekly Prices | 09/28/09 | 09/21/09 | Y/Y | 2008 | 2007 | 2006 |
|---|---|---|---|---|---|---|
| Retail Regular Gasoline ($ per Gallon, Regular) | 2.50 | 2.55 | -31.2% | 3.25 | 2.80 | 2.57 |
| Light Sweet Crude Oil, WTI ($ per bbl.) | 68.41 | 71.36 | -37.9% | 100.16 | 72.25 | 66.12 |
German Orders Growth Extended
by Robert Brusca October 7, 2009
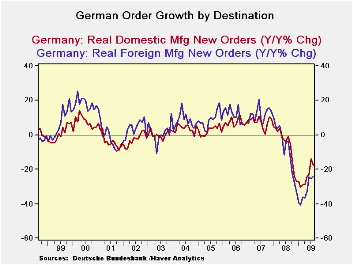
Order Trends: German new orders growth was
extended as foreign orders snapped back after a one-month decline.
Domestic orders fell by 1.9% after surging by 9.5% in July. Orders have
been rising steadily, strongly, over the past six months with domestic
orders up in five of those six months and foreign orders up in four of
those six months. Both series are showing continuing acceleration not
just growth. In the current quarter domestic orders are outpacing on
the back of a one month 9.5% spurt in orders in July as the new quarter
began.
Foreign order sources: Orders from
countries outside the euro zone alone jumped 5.9%, in August while
foreign demand for German manufactured goods from the other 15
countries sharing the euro rose by just 2.8% in August from the month
earlier. Growth outside of the e-Zone drove German orders this past
month.
Euro-Area policy cuts no slack - Apart
from orders, the European Commission Wednesday warned nine countries,
including Germany, that their budget deficits are too large. This is
the legacy effect of having used domestic deficit spending to bolster
the economy in the recession. That policy response was good thing, but
it now puts those countries afoul of EU Commission rules.
Out of touch with reality? The warning
comes at an odd time since Euro-central bankers and policy officials in
the US have underscored that the time is not right to withdraw
stimulus. Hanging the ‘Sword of Damocles’ over the heads of the various
ECB nations does not seem like the right policy tilt to encourage them
to keep their stimulus efforts in place. It sounds a lot like pressure
to get you house in order NOW! The EU Commission is using bad judgment
and being too strict on rules of evaluations at a time like this. Yes
it is just this sort of thinking that keeps the euro strong but it also
unduly complicates and hampers policy. This stance reminds me of the
ECB’s problems in cutting rates in timely fashion in the recession. The
target rate ceiling on the HICP hampered the ECB in the pits of the
crisis. It cut rates as a part of an ‘international effort’, using that
as an excuse to cut rates with headline inflation well over its ceiling
at the time. I suppose we are to understand that this warning from the
EU Commission as a formality that has come as scheduled. But in times
such as these what is the merit? Does this act brand the EU Commission
tough or as out of touch?
| German Orders and Sales By Sector and Origin | ||||||||
|---|---|---|---|---|---|---|---|---|
| Real and SA | % M/M | % Saar | ||||||
| Aug-09 | Jul-09 | Jun-09 | 3-Mo | 6-Mo | 12-Mo | Year Ago | QTR-2-Date | |
| Total Orders | 1.4% | 3.1% | 3.8% | 38.7% | 17.8% | -21.1% | -2.4% | 43.7% |
| Foreign | 4.6% | -2.4% | 6.9% | 42.1% | 19.2% | -24.0% | -3.8% | 30.7% |
| Domestic | -1.9% | 9.5% | 0.5% | 35.5% | 16.4% | -17.6% | -0.9% | 59.5% |
| Real Sector Sales | ||||||||
| MFG/Mining | 2.7% | -0.5% | 1.1% | 13.8% | 6.7% | -16.6% | 1.8% | 14.4% |
| Consumer | 0.4% | -0.7% | 0.1% | -0.8% | -0.4% | -8.4% | -3.0% | -4.8% |
| Consumer Durables | 1.6% | 0.5% | -2.6% | -2.3% | -1.1% | -20.6% | -1.8% | 3.8% |
| Consumer Nondurable | 0.2% | -0.9% | 0.5% | -0.8% | -0.4% | -6.2% | -3.2% | -6.3% |
| Capital Goods | 4.2% | -2.0% | 1.4% | 15.4% | 7.4% | -20.9% | 4.8% | 18.7% |
| Intermediate Goods | 2.5% | 1.3% | 1.6% | 23.9% | 11.3% | -16.2% | 1.0% | 22.9% |
| All Manufacturing Sales | 2.6% | -0.5% | 1.2% | 13.8% | 6.7% | -16.9% | 1.9% | 14.3% |
Central Bank Of Australia Raises Interest Rate 25 Basis Points To 3.25%
by Louise Curley October 6, 2009
 The Central
Bank of Australia raised its policy interest rate from 3.00% to 3.25%
today, the first of the Group of 20 to increase interest rates since
the start of the global financial crisis in late 2007.
The Central
Bank of Australia raised its policy interest rate from 3.00% to 3.25%
today, the first of the Group of 20 to increase interest rates since
the start of the global financial crisis in late 2007.
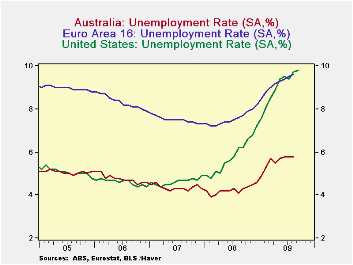
In relative terms, the recession in Australia has been mild. The first two charts comparing the levels in the rate of unemployment and the changes in Gross Domestic Product with those in the United States and the Euro Area show that there has been considerably less unemployment in Australia and that its decline in total activity has been milder and of shorter duration. GDP in Australia has actually increased in the first two quarters of 2009.
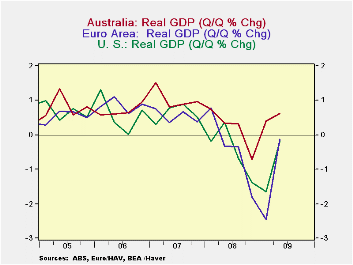
Among the reasons for Australia's better performance is the condition of its financial system. Australia's financial system had not been disrupted to the extent that those of the Americans, British and Europeans had been by unsound practices. Moreover, demand for Australian natural resources has been maintained at relatively high levels. After a slow down in late 2008 Australia's most important trading partner, China, rapidly regained its high growth trend in 2009 and its demand for Australia's resources.
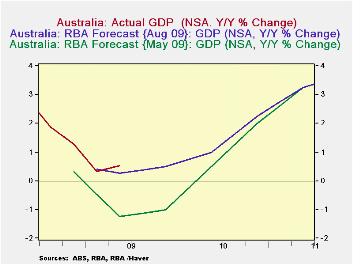 Economic
conditions in Australia in
recent months have been stronger than expected. The
Reserve Bank of Australia publishes quarterly forecasts of
GDP. Its last two forecasts of May 2009 and August 2009 are
shown in the third chart compared with the actual results in the first
and second quarters of 2009. In May, the Bank was forecasting
year over year percent declines for the four quarters of 2009 and for
the first quarter of 2010. The Bank raised its forecast in
August but still actual conditions were stronger than expected. The
bank's forecast for the first and second quarters of this
year--0.40% and 0.25% year over year increases-were below the
actual year over year increases of 0.32% and 0.53% .
Economic
conditions in Australia in
recent months have been stronger than expected. The
Reserve Bank of Australia publishes quarterly forecasts of
GDP. Its last two forecasts of May 2009 and August 2009 are
shown in the third chart compared with the actual results in the first
and second quarters of 2009. In May, the Bank was forecasting
year over year percent declines for the four quarters of 2009 and for
the first quarter of 2010. The Bank raised its forecast in
August but still actual conditions were stronger than expected. The
bank's forecast for the first and second quarters of this
year--0.40% and 0.25% year over year increases-were below the
actual year over year increases of 0.32% and 0.53% .
| UNEMPLOYMENT RATE (%) | Aug 09 | Jul 09 | Jun 09 | May 09 | APR 09 | Mar 09 | FEB 09 | Jan 09 |
|---|---|---|---|---|---|---|---|---|
| Australia | 5.8 | 5.8 | 5.6 | 5.7 | 5.5 | 5.7 | 5.3 | 4.0 |
| Euro Area | 9.6 | 9.5 | 9.4 | 9.3 | 9.2 | 9.0 | 8.8 | 8.5 |
| U. S. | 9.7 | 9.4 | 9.5 | 9.4 | 8.9 | 8.5 | 8.1 | 7.6 |
| GDP (Q/Q % chg) | Q2 09 | Q1 09 | Q4 08 | Q3 08 | Q2 08 | Q1 09 | -- | -- |
| Australia | 0.62 | 0.40 | -0.71 | 0.32 | 0.34 | 0.74 | -- | -- |
| Euro Area | -0.12 | -2.45 | -1.81 | -0.35 | -.033 | 0.79 | -- | -- |
| U. S. | -0.18 | -1.65 | -1.37 | -0.68 | 0.36 | -0.18 | -- | -- |
Weekly Chain Store Sales Tick Higher After Sharp September Decline
by Tom Moeller October 6, 2009
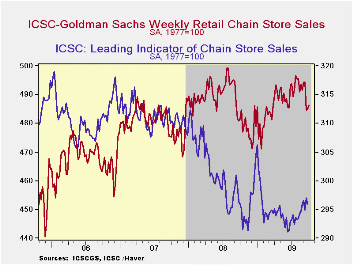
Indications that consumer spending might be improving faded during the last several weeks. During the latest week, chain store sales slipped 0.3% leaving them 0.6% below September after that month's 0.7% decline.
During the last ten years there has been a 69% correlation between the year-to-year growth in chain store sales and the growth in general merchandise sales. The weekly figures are available in Haver's SURVEYW database.
The ICSC-Goldman Sachs retail chain-store sales index is constructed using the same-store sales (stores open for one year) reported by 78 stores of seven retailers: Dayton Hudson, Federated, Kmart, May, J.C. Penney, Sears and Wal-Mart.
Prospects for improvement in sales seem limited. The leading indicator of sales slipped 0.3% (-0.1% y/y) during the latest week though it had risen somewhat earlier this summer.
A Bit Better, But Very Far From Best are yesterday's comments by New York Fed President William C. Dudley and they are available here.
| ICSC-UBS (SA, 1977=100) | 10/03/09 | 09/26/09 | Y/Y | 2008 | 2007 | 2006 |
|---|---|---|---|---|---|---|
| Total Weekly Chain Store Sales | 486.5 | 485.0 | 1.0% | 1.4% | 2.8% | 3.3% |

Tom Moeller
AuthorMore in Author Profile »Prior to joining Haver Analytics in 2000, Mr. Moeller worked as the Economist at Chancellor Capital Management from 1985 to 1999. There, he developed comprehensive economic forecasts and interpreted economic data for equity and fixed income portfolio managers. Also at Chancellor, Mr. Moeller worked as an equity analyst and was responsible for researching and rating companies in the economically sensitive automobile and housing industries for investment in Chancellor’s equity portfolio. Prior to joining Chancellor, Mr. Moeller was an Economist at Citibank from 1979 to 1984. He also analyzed pricing behavior in the metals industry for the Council on Wage and Price Stability in Washington, D.C. In 1999, Mr. Moeller received the award for most accurate forecast from the Forecasters' Club of New York. From 1990 to 1992 he was President of the New York Association for Business Economists. Mr. Moeller earned an M.B.A. in Finance from Fordham University, where he graduated in 1987. He holds a Bachelor of Arts in Economics from George Washington University.
More Economy in Brief