 Global| Oct 27 2006
US GDP Growth Weakest Since 2003
by:Tom Moeller
|in:Economy in Brief
Summary
U.S. real GDP grew just 1.6% (AR) last quarter, well below the 3.5% average of the prior four quarters and the weakest since 1Q 2003. Growth even fell short of Consensus expectations for a 2.5% rise. Virtually all of the [...]
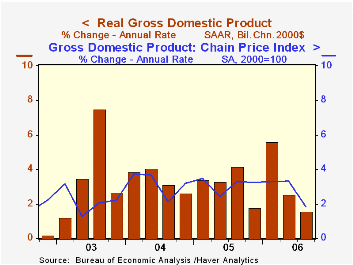
Virtually all of the disappointment was due to housing. Residential investment fell 17.4% (AR, -7.7% y/y) after an 11.1% decline during 2Q. That decline alone sapped 1.1 percentage points from GDP growth last quarter and it was the largest quarterly subtraction made by housing since 1981.
A deterioration in the net export deficit also subtracted 0.6 percentage points from last quarter's growth in real GDP. That followed a 0.4 point addition during 2Q. Exports grew 6.5% (9.0% y/y) but import growth outpaced that with a 7.8% (7.8% y/y) rise. It was paced by a 13.4% rise in nonauto consumer goods, a 15.4% rise in capital goods and an 18.6% rise in industrial supplies & materials other than petroleum.
Growth in final sales to domestic purchasers overall accelerated to 2.2% despite the weakness in housing. The acceleration was due to 3.1% (2.8% y/y) growth in real personal consumption expenditures which was up from 2.6% growth during 2Q while quarterly growth in business fixed investment nearly doubled to 8.6% (7.9% y/y). Equipment & software investment recovered after a 2Q decline with a 6.5% (5.7% y/y) gain. Notably strong was business investment in structures, up 14.1% (13.7% y/y).
Government expenditures also picked up last quarter and grew 1.9% (1.6% y/y) though the Federal government's spending on defense fell 0.7% (-1.1% y/y), the third decline in the last four quarters. 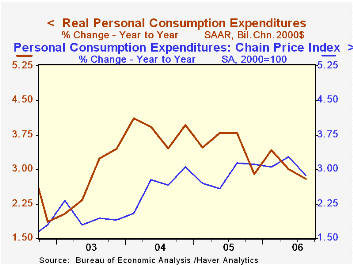
A lessened pace of investment in inventories subtracted 0.1 percentage points from GDP growth following a 0.4 point addition during 2Q.
The GDP chain price index rose just 1.8%, its weakest quarterly advance in over three years. The PCE chain price index grew just 2.5% (2.9% y/y). That increase was held back by quarterly declines in prices of furniture (-4.3% y/y) and apparel (+0.1% y/y). The chain price for residential investment fell 0.4% (+3.1% y/y), the first quarterly decline since early 2002.
Barreling Down the Road To Recession? from the Federal Reserve Bank of St. Louis can be found here.
| Chained 2000$, % AR | 3Q '06 | 2Q '06 | Y/Y | 2005 | 2004 | 2003 |
|---|---|---|---|---|---|---|
| GDP | 1.6% | 2.6% | 2.9% | 3.2% | 3.9% | 2.5% |
| Inventory Effect | -0.1% | 0.4% | 0.6% | -0.3% | 0.4% | 0.0% |
| Final Sales | 1.7% | 2.1% | 2.3% | 3.5% | 3.5% | 2.5% |
| Foreign Trade Effect | -0.6% | 0.4% | -0.1% | -0.1% | -0.5% | -0.3% |
| Domestic Final Demand | 2.2% | 1.6% | 2.4% | 3.6% | 4.0% | 2.8% |
| Chained GDP Price Index | 1.8% | 3.3% | 2.9% | 3.0% | 2.8% | 2.1% |
by Tom Moeller October 27, 2006
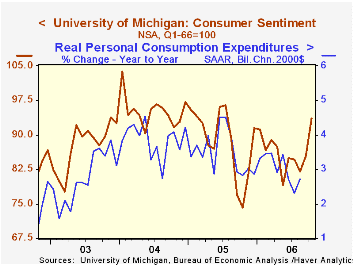
The University of Michigan's full month reading of October consumer sentiment rose 9.6% from September to 93.6 after a preliminary indication of an 8.1% rise. The gain exceeded Consensus expectations for a reading of 92.5 and was to the highest level in over a year.
During the last ten years there has been a 76% correlation between the level of consumer sentiment and the y/y change in real consumer spending and during those ten years sentiment has a 68% correlation with the change in nonfarm payrolls.
Expected inflation during the next year notched up to 3.7% from 3.5% in the preliminary report and from 3.6% in September. Since 1980 there has been an inverse 63% correlation between the level of sentiment and expected inflation during the next year. The five to ten year expected rate of inflation also rose m/m to 3.5% but that was down slightly from the preliminary read.
Expectations for the economy rose 8.4% m/m to the highest level since July of last year. Expected business conditions next year rose 7.4% (17.0% y/y) and over the next five years also rose 5.4% (34.7% y/y) to the highest since July 2005. The expected change in personal finances improved 7.4% (17.0% y/y).
The reading of current economic conditions added to the preliminary gain and surged 11.1% m/m, rising to the highest level since April. The current read of personal finances (22.9% y/y) rose to the best level since April and perceived buying conditions for large household goods recovered all of the prior month's decline and rose 15.1% y/y.
Consumers' opinion about gov't economic policy rose 6.1% (11.5% y/y) after three months having been unchanged. Twenty percent of respondents indicated that a good job was being done, the highest percentage in over a year. Thirty three percent felt that a poor job was being down, the lowest since April.
The University of Michigan survey is not seasonally adjusted.The mid-month survey is based on telephone interviews with 250 households nationwide on personal finances and business and buying conditions. The survey is expanded to a total of 500 interviews at month end.
Consumption Amenities and City Crowdedness from the Federal Reserve Bank of Kansas City can be found here.
Targeting Inflation and the Fiscal Balance: What is the Optimal Policy Mix? also from the Federal Reserve Bank of Kansas City is available here.
| University of Michigan | October (Final) | October (Prelim.) | September | Y/Y | 2005 | 2004 | 2003 |
|---|---|---|---|---|---|---|---|
| Consumer Sentiment | 93.6 | 92.3 | 85.4 | 26.1% | 88.6 | 95.2 | 87.6 |
| Current Conditions | 107.3 | 106.1 | 96.6 | 17.7% | 105.9 | 105.6 | 97.2 |
| Expectations | 84.8 | 83.4 | 78.2 | 34.2% | 77.4 | 88.5 | 81.4 |
by Carol Stone October 27, 2006

Employment in Spain expanded "only" 3.7%, year-on-year, in Q3, less than the 4.2% and 4.9% of Q2 and Q1, respectively. Even so, this is still 2.3 times as fast as the growth in working-age population (age 16 and over) and unemployment continues to fall. In Q3, the unemployment rate was just 8.2%, the lowest since Q2 1979, more than 27 years ago. Further, at that time, the labor force participation rate was only 49.3%, about 9 points lower than the latest 58.4%.
The industrial structure of Spanish employment somewhat resembles that in many Western countries. The number of "industry" jobs has been nearly flat for the last few years. But as seen in the second graph, those jobs had been growing before this: from 1996 to 2002 they expanded at more than a 3.5% annual rate. At the same time, in all of Europe, industry employment was flat, and since the middle of 2001 it has fallen consistently. The service sector in both regions has shown gains, though. For all of Europe, this expansion has been between 2% and 3%, with some slowing recently. In Spain, though, these jobs have been growing at about 5%, and recent periods have maintained that pace. Employment opportunities in Spain look favorable.
On the unemployment side of the ledger, we can't help but recall the riots in France among young frustrated "wannabe" workers just about a year ago. What's the situation in Spain? It seems to be some better. Unemployment rates for ages under 25 are far higher than for the general population, to be sure, with Q3 at 16.9%. But this level includes some improvement. Two years ago, the rate was 21.6%. In the year from Q3 2004 to Q3 2005, employment among this group actually surged by 8.7%; it has held steady at last year's level across the latest four quarters. The resulting unemployment conditions are shown in the last graph, which contains harmonized data compiled by Eurostat and reported yesterday through September. Spain's youth unemployment is now about equal to that of Europe as a whole, a substantial improvement relative to the far higher rates of three years ago and more.
| Spain, NSA, Millions | 3Q 2006 | 2Q 2006 | Q3 2005 | 2005 | 2004 | 2003 |
|---|---|---|---|---|---|---|
| Employment | 19.90 | 19.69 | 19.19 | 18.97 | 17.97 | 17.30 |
| Industry | 3.29 | 3.29 | 3.31 | 3.28 | 3.21 | 3.20 |
| Construction | 2.59 | 2.52 | 2.40 | 2.36 | 2.25 | 2.10 |
| Services | 13.10 | 12.93 | 12.49 | 12.34 | 11.52 | 11.00 |
| Unemployment | 1.76 | 1.84 | 1.76 | 1.91 | 2.21 | 2.24 |
| Unemployment Rate (%) | 8.2 | 8.5 | 8.4 | 9.1 | 11.0 | 11.5 |
| Participation Rate (%) | 58.4 | 58.3 | 57.4 | 57.4 | 56.4 | 55.5 |

Tom Moeller
AuthorMore in Author Profile »Prior to joining Haver Analytics in 2000, Mr. Moeller worked as the Economist at Chancellor Capital Management from 1985 to 1999. There, he developed comprehensive economic forecasts and interpreted economic data for equity and fixed income portfolio managers. Also at Chancellor, Mr. Moeller worked as an equity analyst and was responsible for researching and rating companies in the economically sensitive automobile and housing industries for investment in Chancellor’s equity portfolio. Prior to joining Chancellor, Mr. Moeller was an Economist at Citibank from 1979 to 1984. He also analyzed pricing behavior in the metals industry for the Council on Wage and Price Stability in Washington, D.C. In 1999, Mr. Moeller received the award for most accurate forecast from the Forecasters' Club of New York. From 1990 to 1992 he was President of the New York Association for Business Economists. Mr. Moeller earned an M.B.A. in Finance from Fordham University, where he graduated in 1987. He holds a Bachelor of Arts in Economics from George Washington University.
More Economy in Brief


