 Global| Apr 28 2006
US GDP Growth Back on Track in 1Q
by:Tom Moeller
|in:Economy in Brief
Summary
US real growth during 1Q06 rebounded smartly to 4.8% (AR) from a lull the prior quarter at 1.7%, but the two quarter average of growth at 3.2% was somewhat depressed from the 3.9% quarterly average of 2004 & 2005. The 1Q increase [...]
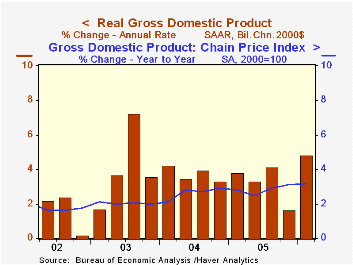
Personal consumption expenditures bounced back to a 5.5% (3.4% y/y) rate of growth from the 0.9% 4Q pause. Motor vehicles & parts consumption grew 19.8% (-4.5% y/y) but that only recovered half of the prior period's slump. Furniture & household equipment spending continued strong with a 23.3% (13.3% y/y) rate of growthand apparel spending also advanced a firm 7.8% (7.1% y/y).
Defense spending recovered all of its 4Q slump with a 10.3% (3.5% y/y) advance and that contributed 0.5% percentage points to 1Q GDP growth.
Growth in business fixed investment nearly doubled the already strong 4Q rate of growth with a 17.9% (12.1% y/y) advance. Much of the acceleration owed to a 10.8% (8.1% y/y) rise in information processing equipment & software which more than doubled the prior quarter's rate of advance. Industrial equipment, however, again was strong with a 12.2% (6.9% y/y) increase and investment in transportation equipment jumped 45.0% (15.0% y/y). That more than recouped a 4Q decline. Structures spending again was quite firm and registered 22.3% (19.5% y/y) growth.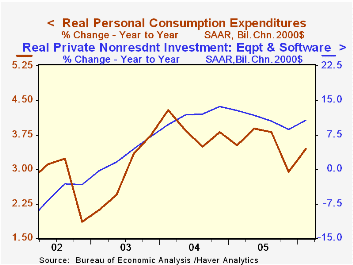
Business Capital Spending, a speech by Federal Reserve Board Governor Donald L. Kohn yesterday to the Forecasters Club of New York, can be found here.
A wider foreign trade deficit subtracted another 0.8 percentage points from GDP growth last quarter as a 12.1% (7.5% y/y) advance in exports was outpaced by 13.0% (6.6% y/y) growth in imports.Inventories reversed a piece of the prior quarter's positive contribution to GDP growth with a 0.5% subtraction.
The GDP chain price index remained firm and grew 3.3%. Strength again owed much to the price index for the government sector which advanced 5.0% (5.2% y/y). The PCE chain price index rose a moderate 2.0% (3.0% y/y) and the price index for business equipment & software was unchanged (-0.9% y/y) following several quarters of decline.
The latest Beige Book from The Federal Reserve Board covering economic activity in the twelve Federal Reserve Districts can be found here.
| Chained 2000$, % AR | 1Q '06 | 4Q '05 | Y/Y | 2005 | 2004 | 2003 |
|---|---|---|---|---|---|---|
| GDP | 4.8% | 1.7% | 3.5% | 3.5% | 4.2% | 2.7% |
| Inventory Effect | -0.5% | 1.9% | -0.3% | -0.3% | 0.3% | 0.0% |
| Final Sales | 5.4% | -0.2% | 3.8% | 3.8% | 3.9% | 2.7% |
| Foreign Trade Effect | -0.8% | -1.4% | 0.1% | -0.1% | -0.5% | -0.3% |
| Domestic Final Demand | 5.9% | 1.1% | 3.9% | 3.9% | 4.4% | 3.0% |
| Chained GDP Price Index | 3.3% | 3.5% | 3.2% | 2.8% | 2.6% | 2.0% |
by Tom Moeller April 28, 2006
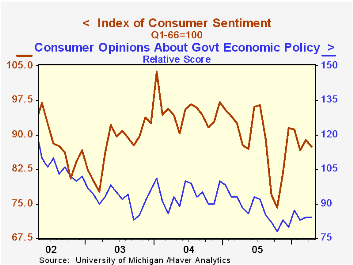
Consumer sentiment slipped late this month. The final reading from the University of Michigan's stood a 87.4 versus a preliminary indication of 89.2 posted two weeks ago. Consensus expectations had been for a reading of 89.0.
Expectations for the economy worsened and for price inflation, moved up. During the last ten years there has been a 76% correlation between the level of consumer sentiment and the y/y change in real consumer spending.
The current conditions ended up about unchanged index for the month versus a preliminary indication of moderate m/m 1.8% improvement. The index of personal finances rose slightly (5.3% y/y) after a sharp gain during March but the reading of buying conditions for large household goods was unchanged (4.4% y/y). Consumers' assessment of gov't economic policy fell hard late in the month and was unchanged for the whole period versus March (-4.5% y/y).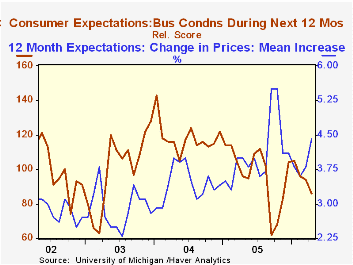
The index of consumer expectations fell 3.4% m/m and that was much worse than the preliminary indication of a 1.2% slip. The near term economic outlook took a powder late in the month and fell 10.4% y/y and the long term outlook reversed much of the prior month's improvement (-8.8% y/y).
The mean expected inflation rate for the next twelve months jumped to 4.4% from an expected 3.8% last month due the rise in gasoline prices.
The University of Michigan survey is not seasonally adjusted.The mid-month survey is based on telephone interviews with 250 households nationwide on personal finances and business and buying conditions. The survey is expanded to a total of 500 interviews at month end.
| University of Michigan | April | March | Y/Y | 2005 | 2004 | 2003 |
|---|---|---|---|---|---|---|
| Consumer Sentiment | 87.4 | 88.9 | -0.3% | 88.6 | 95.2 | 87.6 |
| Current Conditions | 109.2 | 109.1 | 4.6% | 105.9 | 105.6 | 97.2 |
| Expectations | 73.4 | 76.0 | -4.7% | 77.4 | 88.5 | 81.4 |
by Tom Moeller April 28, 2006
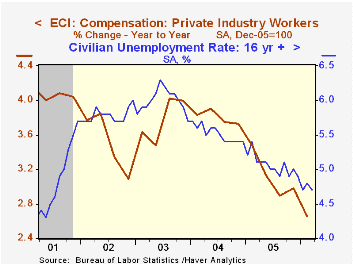
The employment cost index for private industry workers rose a moderate 0.6% last quarter after a downwardly revised 0.7% increase to close out 2005. Downward revisions to earlier quarters (mostly in benefit costs) resulted in a picture of sharp deceleration in compensation costs during the last two years. Consensus expectations had been for a 0.9% 1Q increase.
The 2.6% increase in the ECI during the last twelve months was the slowest in ten years.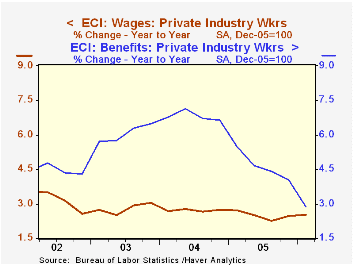
The 0.4% 1Q increase in benefit costs halved the prior quarter's growth rate and continued a downtrend that since early 2004 has pulled the y/y growth rate to 2.9% from 7.2%. (Annual growth during 2004 was revised to 6.6% from 10.1% reported earlier.)
Wage and salary growth was up slightly to 0.7% from 0.6% averaged during 2005. Service producing industries saw a 0.8% (2.4% y/y) gain while factory sector wages grew 0.5% (NSA, 2.5% y/y).
The latest release encompassed several revisions. To review the latest changes visit BLS site.
| ECI- Private Industry Workers | 1Q '06 | 4Q '05 | Y/Y | 2005 | 2004 | 2003 |
|---|---|---|---|---|---|---|
| Compensation | 0.6% | 0.7% | 2.6% | 3.0% | 3.7% | 4.0% |
| Wages & Salaries | 0.7% | 0.6% | 2.5% | 2.5% | 2.7% | 3.0% |
| Benefit Costs | 0.4% | 0.7% | 2.9% | 4.0% | 6.6% | 6.5% |
by Carol Stone April 28, 2006
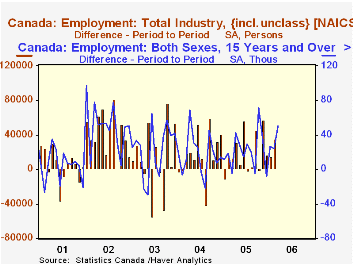
Besides its monthly labor force survey to measure the number of people employed, Statistics Canada also conducts a survey of establishments, similar to that in the United States. These industry establishment data are part of the compilation of Canada's monthly GDP series. As with the labor force series, the industry data show good jobs growth in the first two months of 2006, including gains of 15,087 and 34,641 in January and February, respectively.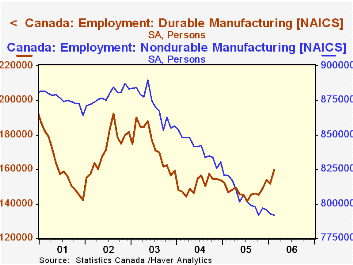
At the same time, the establishment data indicate some firming in the manufacturing sector that is not evident in the labor force series. After a long decline, the former began to turn upward in November; the cumulative increase over the four months is only 12,600, but it includes a more marked upturn in the durable goods sector totaling 18,300 since last July. Employment at nondurable goods manufacturers continues in a downward drift. By contrast, the labor force measure shows that the number of people working in manufacturing is still falling, a decrease of 1.2% since October, compared to the 0.7% increase in manufacturing company jobs. These series are not well correlated month-to-month, and can be erratic, so these comparisons could easily be erased by one or two months of reversals in either dataset. Even so, the gain in manufacturing establishment jobs is intriguing, and the labor force series bears monitoring for a sign of new growth there.
Service sector jobs are picking up steam in the establishment data. These had slowed to just a 1.4% increase in 2004, but grew 1.9% last year and through February were already 2.4% ahead of a year ago. The gain in the service industries and the better performance of manufacturing are contributing to growth in Canada's monthly GDP of 3.3% year-on-year in February, somewhat firmer than last year's overall increase of 3.0%.
| SA, Thousands | Feb 2006 | Jan 2006 | Year Ago | 2005 | 2004 | 2003 |
|---|---|---|---|---|---|---|
| Total NAICS Industries | 13,922 | 13,887 | 13,647 | 13,743 | 13,515 | 13,337 |
| Mo/Mo (000) & Yr/Yr % Changes | 34.6 | 15.1 | 2.0% | 1.7% | 1.3% | 2.1% |
| Manufacturing | 1,950 | 1,944 | 1,967 | 1,952 | 1,991 | 2,045 |
| Mo/Mo (000) & Yr/Yr % Changes | 6.1 | -4.9 | -0.8% | -2.0% | -2.6% | -0.3% |
| Service Producing | 10,709 | 10,682 | 10,463 | 10,550 | 10,351 | 10,213 |
| Mo/Mo (000) & Yr/Yr % Changes | 26.9 | 18.9 | 2.4% | 1.9% | 1.4% | 2.1% |
| GDP: Mo/Mo & Yr/Yr % Changes | 0.2% | 0.2% | 3.3% | 3.0% | 3.2% | 2.3% |

Tom Moeller
AuthorMore in Author Profile »Prior to joining Haver Analytics in 2000, Mr. Moeller worked as the Economist at Chancellor Capital Management from 1985 to 1999. There, he developed comprehensive economic forecasts and interpreted economic data for equity and fixed income portfolio managers. Also at Chancellor, Mr. Moeller worked as an equity analyst and was responsible for researching and rating companies in the economically sensitive automobile and housing industries for investment in Chancellor’s equity portfolio. Prior to joining Chancellor, Mr. Moeller was an Economist at Citibank from 1979 to 1984. He also analyzed pricing behavior in the metals industry for the Council on Wage and Price Stability in Washington, D.C. In 1999, Mr. Moeller received the award for most accurate forecast from the Forecasters' Club of New York. From 1990 to 1992 he was President of the New York Association for Business Economists. Mr. Moeller earned an M.B.A. in Finance from Fordham University, where he graduated in 1987. He holds a Bachelor of Arts in Economics from George Washington University.
More Economy in Brief


