 Global| Nov 29 2007
US 3Q GDP Up 4.9%: Trade & Inventories Boosted Revision, Profits Fell
by:Tom Moeller
|in:Economy in Brief
Summary
U.S. real GDP growth during the third quarter was revised upward to 4.9% (AR) from 3.9% in the advance report. The latest figures from the Commerce Department were about as expected. The revision came from two components only: net [...]
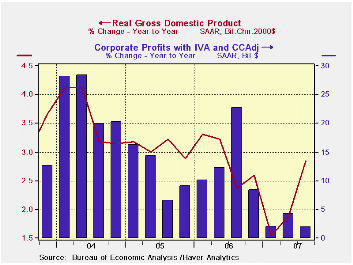
U.S. real GDP growth during the third quarter was revised upward to 4.9% (AR) from 3.9% in the advance report. The latest figures from the Commerce Department were about as expected. The revision came from two components only: net exports and inventories.
Improvement in the net export deficit added 1.4 percentage points to GDP growth during 3Q versus an initial indication of a 0.9 point add. During 2Q, improved net exports made a 1.3 percentage point growth contribution. A modest upward revision to export growth to 18.9% (AR, 10.2% y/y) added 2.1 points to GDP growth and a modest downward revision to import growth to 4.2% (1.7% y/y) left imports subtracting 0.7 points from growth.
Inventories added a revised 1.0 percentage
points to 3Q growth in GDP versus an initial indication of just a 0.4
add. Inventories contributed 0.2 points to 2Q growth and that
contribution has been negative this year.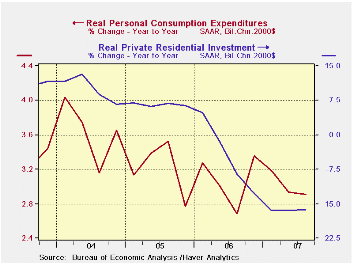
Overall corporate profits fell at a 4.6% annual rate (+1.9% y/y) last quarter. The housing market's travails weighed down the financial sector' earnings by 20.5% (AR, +3.4% y/y). Domestic nonfinancial sector profitability also fell 5.9% (AR, -8.3% y/y) as costs rose but the lower dollar boosted rest of world earnings by 30.9% (AR, 34.7% y/y).
Growth in final sales to domestic purchasers actually was taken down a notch to 2.4% but still remained slightly improved from the 2.1% growth during the second quarter.
The drop in residential investment last quarter was left roughly unchanged and it fell 19.7% (AR, -6.3% y/y). It subtracted 1.0 percentage points from growth during 3Q after subtractions of between 0.6 and 1.3 percentage points in each of the prior five quarters.
Firm growth in business fixed investment continued as the
underpinning of US demand. The 9.4% (5.2% y/y) rate of growth was
upwardly revised and it added 1.0 percentage points to 3Q growth, about
the same as during 2Q. Spending on structures was upwardly revised with
a 14.3% rate of growth (13.3% y/y) and spending on equipment &
software also was revised up to 7.2% (AR, 1.7% y/y) after weak growth
or q/q declines from 2Q '06 to 1Q '07.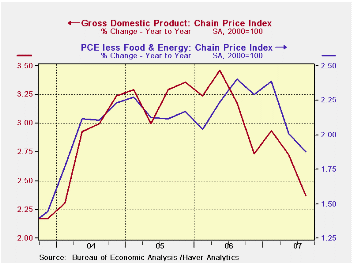
Growth in real personal consumption expenditures was taken down a notch to 2.7% (2.9% y/y) but it still was double growth during 2Q. Growth in spending on durable goods rose 4.0% (4.6% y/y) despite a 4.9% drop in spending on motor vehicles. Nondurable goods spending rose 1.9% (2.2% y/y), which was lower than originally indicated, and services spending growth held steady at 2.8% (3.0% y/y).
The GDP chain price index was left little changed at a 0.9% growth rate. Nonresidential (+0.8% y/y) and residential (+0.7 y/y) investment price indexes both fell during 3Q while consumer prices rose 1.7% (2.% y/y), held back by the decline in gasoline prices. Less food & energy consumer prices rose 2.2% (2.2% y/y), a number that was revised up slightly.
The latest Beige Book from the Federal Reserve Board is available here.
| Chained 2000$, % AR | 3Q '07 Preliminary | 3Q ' 07 Advance | 2Q '07 | Y/Y | 2006 | 2005 | 2004 |
|---|---|---|---|---|---|---|---|
| GDP | 4.9 | 3.9 | 3.8 | 2.8 | 2.9 | 3.1 | 3.6 |
| Inventory Effect | 1.0 | 0.4 | 0.2 | -0.4 | 0.1 | -0.2 | 0.4 |
| Final Sales | 3.9 | 3.5 | 3.6 | 3.1 | 2.8 | 3.3 | 3.3 |
| Foreign Trade Effect | 1.4 | 0.9 | 1.3 | 0.9 | -0.1 | -0.2 | -0.7 |
| Domestic Final Demand | 2.4 | 2.5 | 2.1 | 2.1 | 2.7 | 3.3 | 3.8 |
| Chained GDP Price Index | 0.9 | 0.8 | 2.6 | 2.4 | 2.6 | 1.7 | 2.1 |
by Tom Moeller November 29, 2007

New single family home sales rose a modest 1.7% last month to 728,00 but the prior month's figures were revised down to the point where so far this year, new home sales are down by nearly one third. Sales during the latest three months were 45.3% below the peak hit in the middle of 2005.
In the West, sales fell 15.7% last month to a new low and
reversed all of a downwardly revised gain in September. Sales out West
are down by more than one third this year and they are down by two
thirds from the 2005 peak. Sales in the Northeast ticked up 1.8% and
they have moved erratically sideways this year. Sales in the Midwest
posted a 14.2 m/m gain but are off by one third since year end 2006.
Sales in the South also rose 6.8% m/m but are down one quarter this
year.
All this weakness in sales has done nothing for prices and they fell another 8.6% last month. The decline left prices down 17.1% from the peak earlier this year.
The number of homes for sale continued down another 2.3% last
month and the supply of homes is off a moderate 3.6% this year.
However, at the current low sales rate, the months' supply of homes on
the market is 8.5, down slightly from September but still double the
rate for all of 2005.
| US New Homes | October | September | Y/Y | 2006 | 2005 | 2004 |
|---|---|---|---|---|---|---|
| Total Sales (SAAR, 000s) | 728 | 716 | -23.5% | 1,049 | 1,279 | 1,201 |
| Median Price (NSA, $) | 217,800 | 238,400 | -13.0% | 243,067 | 234,208 | 217,817 |
by Tom Moeller November 29, 2007
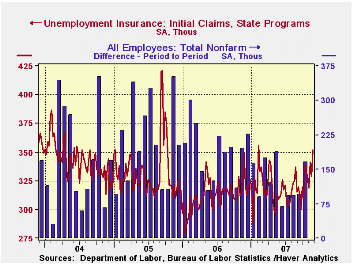
Initial claims for unemployment insurance surged much more than expectations to the highest level since early this year. The 23,000 rise last week to 352,000 followed a little revised 12,000 decline during the week prior. The early timing of this year's Thanksgiving holiday may have affected the latest figure.
A claims level below 400,000 typically has been associated with growth in nonfarm payrolls. During the last six years there has been a (negative) 78% correlation between the level of initial claims and the m/m change in nonfarm payroll employment.
The four week moving average of initial claims rose to 335,250
(3.3% y/y) and that was up 3.5% from the prior four weeks.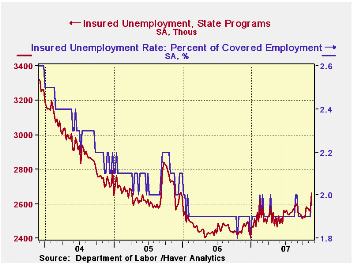
The largest increases in initial claims for the week ending Nov. 17 were in Texas (+1,097), Kentucky (+797), Idaho (+341), Arkansas (+219), and Wisconsin (+209), while the largest decreases were in Michigan (-6,493), California (-5,905), Puerto Rico (-3,882), New Jersey (-3,011), and Virginia (-1,542).
Continuing claims for unemployment insurance surged 112,000 from the prior week, the largest one week increase since early this year, and it followed modest decline in the prior three weeks.
The continuing claims numbers lag the initial claims figures by one week.
The insured rate of unemployment rose slightly to 2.0% from 1.9% during the prior week.
| Unemployment Insurance (000s) | 11/24/07 | 11/17/07 | Y/Y | 2006 | 2005 | 2004 |
|---|---|---|---|---|---|---|
| Initial Claims | 352 | 329 | 0.9% | 313 | 331 | 343 |
| Continuing Claims | -- | 2,665 | 8.2% | 2,459 | 2,662 | 2,924 |
by Tom Moeller November 29, 2007
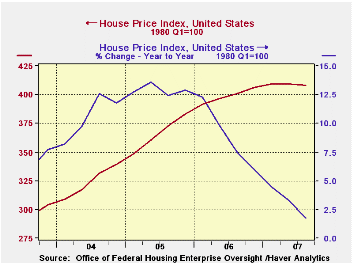
According to the Office of Federal Housing Enterprise Oversight (OFHEO), home prices in the U.S. fell last quarter and that was the first q/q decline since 1994. The decline pulled the y/y change in prices to a still positive 1.7% but that overall rate of appreciation is down from the double digit rates of gain during 2004 and 2005.
The House Price Indices in this report are weighted indexes
based on repeat sales or refinancings using data provided by Fannie Mae
or Freddie Mac. The overall figures are available in Haver's USECON
data base and the state figures are in USREGIONAL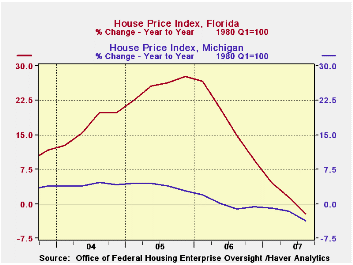
Price declines were scattered throughout the country. Job cutbacks in the auto industry helped lower prices in Michigan for the sixth consecutive quarter and in New York prices fell 0.5%. Prices in Florida fell for only the second quarter but the y/y rate of gain of 1.3% compares to staggering rates of growth in earlier years. Prices also fell in Massachusetts for the fourth quarter in the last five (-1.0% y/y) and prices in Nevada fell 1.6% (-1.5% y/y).
The latest report from the Office of Federal Housing Enterprise Oversight (OFHEO) can be found here.
Defining and Detecting Predatory Lending from the Federal Reserve Bank of New York is available here.
| House Price Index (OFHEO) | 3Q '07 | 2Q '07 | Y/Y | 2006 | 2005 | 2004 |
|---|---|---|---|---|---|---|
| United States | -0.4% | 0.1% | 1.8% | 8.8% | 12.9% | 10.6% |
| California | -1.2% | -0.7% | -1.4% | 11.7% | 23.3% | 22.2% |
| New Jersey | -0.3% | 0.5% | 1.9% | 10.2% | 16.0% | 14.9% |
| New York | -0.5% | 0.6% | 2.1% | 8.5% | 13.6% | 13.3% |
| Michigan | -1.4% | -0.3% | -1.4% | 0.2% | 4.0% | 4.2% |
| Florida | -0.8% | -0.2% | 1.3% | 17.6% | 25.7% | 17.0% |
by Robert Brusca November 29, 2007
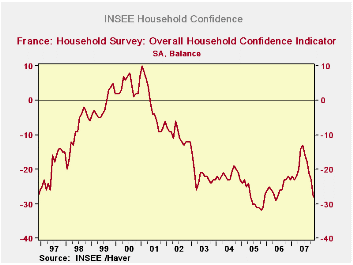
The abrupt drop in French consumer confidence in the INSEE
survey is sharp and as strong a reversal as appeared in early 2001.
Confidence itself at -28 in the 11 percentile of that variable’s range
– very weak showing. Living standards over the past 12 months as well
as those expected in the next twelve months rank in the bottom eight
percent of the range for such responses historically. Expected
unemployment in the next 12 months is barely below the mid point of its
historic range at a level of 13.
Price developments over the past 12 months have given the
second highest reading ever (since January 1990). Expected price
developments in the 12 months ahead are still elevated in the 57th
percentile of their range.
Oddly the ‘favorable to save’ response ranks above its
midpoint at the sixty-first percentile. But ‘the ability to save’ ranks
in the bottom third of its range.
The financial situation is assessed as being in its 57th
percentile at a reading of +15, a slippage from October’s 16. But the
past 12 months are assessed as having been in the 40th percentile of
their range; what’s worse is that the next 12 months are assessed as
being in the bottom third of theirs.
The French consumer has shed all the post election visions of
nirvana and Sarkozy’s honeymoon is over. The strong euro, ongoing
budget fights, and racial unrest in Paris’ suburbs are taking their
toll despite the spirit of optimism that swept him into office and
lingered…for a while.
| INSEE Household Monthly Survey | ||||||||||
|---|---|---|---|---|---|---|---|---|---|---|
| Since Jan 1990 | Since Jan 1990 | |||||||||
| Oct 07 |
Sep 07 |
Aug 07 |
Jul 07 |
%tile | Rank | Max | Min | Range | Mean | |
| Household Confidence | -22 | -21 | -17 | -15 | 25.6 | 118 | 10 | -33 | 43 | -17 |
| Living Standards | ||||||||||
| Past 12-Mos | -53 | -50 | -47 | -46 | 15.5 | 153 | 18 | -66 | 84 | -37 |
| Next 12-Mos | -24 | -26 | -17 | -11 | 31.6 | 103 | 15 | -42 | 57 | -18 |
| Unemployment: Next 12 | 11 | 11 | 0 | -7 | 43.6 | 155 | 73 | -37 | 110 | 30 |
| Price Developments | ||||||||||
| Past 12-Mos | 14 | 10 | 5 | 1 | 81.6 | 22 | 30 | -57 | 87 | -20 |
| Next 12-Mos | -18 | -15 | -20 | -26 | 46.2 | 19 | 31 | -60 | 91 | -34 |
| Savings | ||||||||||
| Favorable to save | 32 | 36 | 35 | 32 | 77.8 | 23 | 40 | 4 | 36 | 23 |
| Ability to save Next 12 | -6 | -5 | -5 | -4 | 58.6 | 67 | 6 | -23 | 29 | -8 |
| Spending | ||||||||||
| Favorable for major purchase | -10 | -8 | -6 | -3 | 55.2 | 62 | 16 | -42 | 58 | -12 |
| Financial Situation | ||||||||||
| Current | 16 | 16 | 15 | 15 | 61.9 | 39 | 24 | 3 | 21 | 12 |
| Past 12-Mos | -16 | -15 | -14 | -14 | 50.0 | 85 | -5 | -27 | 22 | -16 |
| Next 12-Mos | -5 | -4 | -3 | -1 | 40.7 | 172 | 11 | -16 | 27 | 0 |
| Number of observations in the period | 208 | |||||||||
by Robert Brusca November 29, 2007
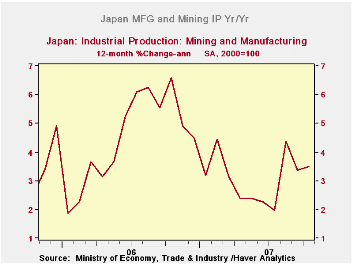
Japan continued to see its textile business eaten alive by
international competition in October. Still, manufacturing output rose
by 1.6% month-to-month and stands higher year/year by 3.5% after rising
6.6% the year before.
Consumer goods and intermediate goods continue to show solid
gains. Investment goods output is off by 1.7% year/year and is off at a
4.3% annual rate over three months.
On the whole, Japan’s industrial sector is doing well, living
off exports while domestic demand is still trying to find its way.
| Japan Industrial Production Trends | |||||||
|---|---|---|---|---|---|---|---|
| m/m % | Saar % | Yr/Yr | |||||
| Oct-07 | Sep-07 | Aug-07 | 3-mo | 6-mo | 12-mo | Yr-Ago | |
| Mining & Manufacturing | 1.6% | -1.4% | 3.5% | 15.6% | 8.9% | 3.5% | 6.6% |
| Total Industry | 1.4% | -1.3% | 3.8% | 16.5% | 7.6% | 3.3% | 6.3% |
| Manufacturing | 1.6% | -1.4% | 3.5% | 15.6% | 8.9% | 3.5% | 6.6% |
| Textiles | -0.3% | -1.0% | -1.0% | -8.8% | -4.2% | -5.5% | -2.3% |
| Transport | 6.7% | -6.3% | 19.1% | 101.5% | 32.3% | 11.5% | 14.2% |
| Product Group | |||||||
| Consumer Goods | 1.6% | -2.2% | 8.8% | 36.5% | 5.7% | 2.9% | 5.7% |
| Intermediate Goods | 1.2% | 0.0% | 2.8% | 17.3% | 11.9% | 5.9% | 7.1% |
| Investment Goods | 1.9% | -5.3% | 2.5% | -4.3% | 1.6% | -1.7% | 6.3% |
| Mining | -2.9% | 2.9% | -0.6% | -2.9% | 6.7% | 4.7% | 6.4% |
| Electricity & Gas | -3.0% | 1.8% | 8.7% | 32.7% | -0.3% | 2.5% | 2.9% |
by Robert Brusca November 29, 2007
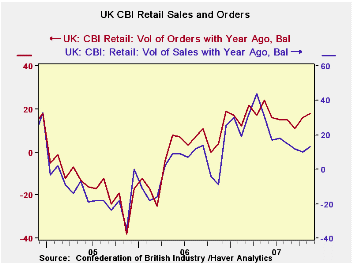
The UK retail sector is stuck more or less mid range. Various
components are generally at or above the mid point of their respective
ranges. Orders, the relative strongest component, resides in the 70th
percentile of its range. Sales are in the 52nd
percentile. Sales for the time of year are in the 44th
percentile. The stock-to-sales ratio is a touch high in the 60th
percentile of its range. The various expected sales and orders are
generally in the same relative positions. See the table below. The chart on the left shows that
while variables remain mid range there has been some slippage recently
in the trend for sales, while orders trends have held a bit firmer.
| UK Retail Volume Data CBI Survey | |||||||||
|---|---|---|---|---|---|---|---|---|---|
| Reported: | Nov-07 | Oct-07 | Sep-07 | Aug-07 | 12MO Avg | Pcntle | Max | Min | Range |
| Sales/Yr Ago | 13 | 10 | 12 | 15 | 22 | 52% | 57 | -35 | 92 |
| Orders/Yr Ago | 18 | 16 | 11 | 15 | 17 | 70% | 42 | -38 | 80 |
| Sales: Time/Yr | -3 | 0 | -1 | -7 | 5 | 44% | 41 | -37 | 78 |
| Stocks: Sales | 18 | 13 | 12 | 14 | 12 | 60% | 30 | 0 | 30 |
| Expected: | |||||||||
| Sales/Yr Ago | 15 | 16 | 17 | 14 | 18 | 53% | 49 | -23 | 72 |
| Orders/Yr Ago | 12 | 16 | 18 | 6 | 12 | 64% | 38 | -34 | 72 |
| Sales: Time/Yr | 2 | -9 | 2 | -5 | 3 | 53% | 29 | -29 | 58 |
| Stocks: Sales | 12 | 5 | 10 | 6 | 9 | 50% | 21 | 3 | 18 |

Tom Moeller
AuthorMore in Author Profile »Prior to joining Haver Analytics in 2000, Mr. Moeller worked as the Economist at Chancellor Capital Management from 1985 to 1999. There, he developed comprehensive economic forecasts and interpreted economic data for equity and fixed income portfolio managers. Also at Chancellor, Mr. Moeller worked as an equity analyst and was responsible for researching and rating companies in the economically sensitive automobile and housing industries for investment in Chancellor’s equity portfolio. Prior to joining Chancellor, Mr. Moeller was an Economist at Citibank from 1979 to 1984. He also analyzed pricing behavior in the metals industry for the Council on Wage and Price Stability in Washington, D.C. In 1999, Mr. Moeller received the award for most accurate forecast from the Forecasters' Club of New York. From 1990 to 1992 he was President of the New York Association for Business Economists. Mr. Moeller earned an M.B.A. in Finance from Fordham University, where he graduated in 1987. He holds a Bachelor of Arts in Economics from George Washington University.
More Economy in Brief


