 Global| Dec 20 2007
US 3Q GDP Still Up 4.9%, Profits Still Down
by:Tom Moeller
|in:Economy in Brief
Summary
Growth in U.S. real GDP last quarter was unrevised at 4.9% (AR) after the sharp upward revision last month. The figures from the Commerce Department were as expected. Most components were little revised, including the sharp drop in [...]
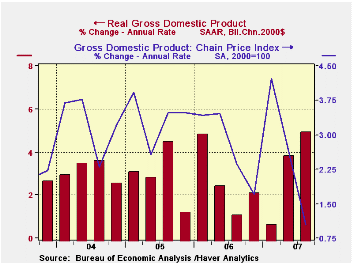
Growth in U.S. real GDP last quarter was unrevised at 4.9% (AR) after the sharp upward revision last month. The figures from the Commerce Department were as expected. Most components were little revised, including the sharp drop in corporate profits.
Last quarter's growth in GDP still is estimated to have stemmed mostly (1.4 percentage points) from improvement in net exports, led by 19.1% (10.3% y/y) growth in real exports.
Inventories added a revised 0.9 percentage points which was negligibly lower than estimated last month. Faster accumulation added 0.2 points to growth to 2Q growth.
Corporate profits are estimated to have fallen 4.9% at an annual rate (+1.8% y/y) versus an initial read of a 4.6% decline. The housing market's decline is till estimated to have lowered the financial sector' earnings by 22.7% (AR, +2.6% y/y). Domestic nonfinancial sector profitability also fell 7.0% (AR, -8.6% y/y) as costs rose. The lower dollar boosted rest of world earnings by 38.0% (AR, 36.5% y/y). Revisions to each of these figures were moderate.
Growth in final sales to domestic purchasers
was left about unchanged at 2.4%.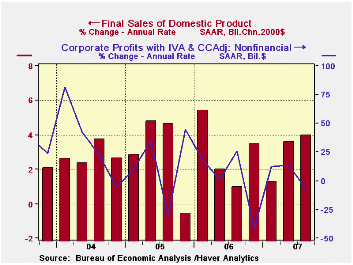
A revised 20.7% collapse in residential investment last quarter (AR, -15.9% y/y) was little changed and subtracted 1.1 percentage points from growth during 3Q.
Strength in business fixed investment continued and was little revised at 8.7% (6.0% y/y). That added 1.0 percentage points to 3Q growth. Spending on structures grew 17.0% (16.1% y/y) and spending on equipment & software grew 5.1% (AR, 1.8% y/y).
Growth in real personal consumption expenditures was little changed at 2.8% (2.9% y/y) but it still was double growth during 2Q.
The GDP chain price index was little changed at a 1.0%.
Can You Hear Me Now? is the latest from the Federal Reserve Bank of St. Louis and analyzes recent changes to communications from the Fed. It can be found here.
| Chained 2000$, % AR | 3Q '07 Final |
3Q '07 Preliminary | 3Q ' 07 Advance |
2Q '07 | Y/Y | 2006 | 2005 | 2004 |
|---|---|---|---|---|---|---|---|---|
| GDP | 4.9 | 4.9 | 3.9 | 3.8 | 2.8 | 2.9 | 3.1 | 3.6 |
| Inventory Effect | 0.9 | 1.0 | 0.4 | 0.2 | -0.4 | 0.1 | -0.2 | 0.4 |
| Final Sales | 4.0 | 3.9 | 3.5 | 3.6 | 3.1 | 2.8 | 3.3 | 3.3 |
| Foreign Trade Effect | 1.4 | 1.4 | 0.9 | 1.3 | 0.9 | -0.1 | -0.2 | -0.7 |
| Domestic Final Demand | 2.5 | 2.4 | 2.5 | 2.1 | 2.1 | 2.7 | 3.3 | 3.8 |
| Chained GDP Price Index | 1.0 | 0.9 | 0.8 | 2.6 | 2.4 | 2.6 | 1.7 | 2.1 |
by Tom Moeller December 20, 2007
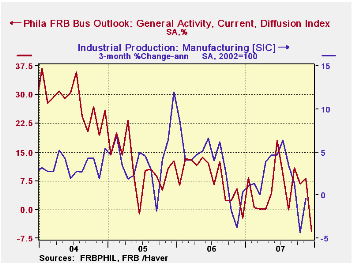
The Philadelphia Federal Reserve Bank reported that it's Index of General Business Conditions in the manufacturing sector plunged this month to -5.7. The decline into negative territory was to the lowest level since June 2003.
The index is a diffusion index for each component or series. It reflects the increase in activity reported less the decrease.
During the last ten years there has been a 59% correlation between the level of the Philadelphia Fed Business Conditions Index and the three-month growth in factory sector industrial production. There has been a 42% correlation with q/q growth in real GDP.
The decline did not represent broad based weakness amongst the
sub indexes. In fact new orders, shipments, unfilled orders and vendor
deliveries each rose. However, the inventories and the employment
indexes fell. During the last ten years there has been a 75%
correlation between the employment index and the three-month growth in
factory payrolls.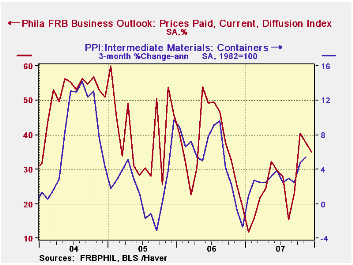
The business conditions index reflects a separate survey question, not the sub indexes.
The prices paid index fell and reversed increases during the prior two months. During the last ten years there has been a 76% correlation between the prices paid index and the three-month growth in the intermediate goods PPI. There has been an 85% correlation with the change in core intermediate goods prices.
The separate index of expected business conditions in six months fell further and added to its plunge during November. The latest was the lowest reading in twelve months. Expectations for new orders plummeted but expectations for the number of employees rose.
The latest Survey of Professional Forecasters from the Federal Reserve Bank of Philadelphia is available here.
| December | November | Dec. ‘06 | 2007 | 2006 | 2005 | |
|---|---|---|---|---|---|---|
| General Activity Index | -5.7 | 8.2 | 5.4 | 5.1 | 8.1 | 11.5 |
| Prices Paid Index | 35.0 | 37.7 | 25.2 | 26.3 | 36.6 | 40.1 |
by Tom Moeller December 20, 2007
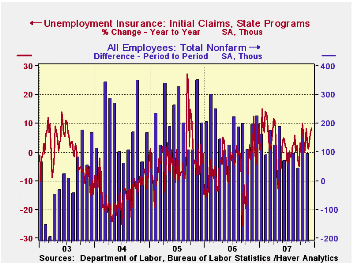
Last week, initial claims for jobless insurance jumped 12,000 to 346,000 after a 5,000 decline during the prior week.
The data are for the survey week for December nonfarm payrolls and claims rose 17,000 (5.2%) from the November period.
A claims level below 400,000 typically has been associated with growth in nonfarm payrolls. During the last six years there has been a (negative) 78% correlation between the level of initial claims and the m/m change in nonfarm payroll employment.
The four week moving average of initial claims, a measure which smoothes out most of the series' w/w volatility, rose to 343,000 (5.3% y/y), the highest level since 2005.
Continuing claims for unemployment insurance rose 12,000 after a 41,000 increase during the prior week.
The continuing claims numbers lag the initial claims figures by one week.
The insured rate of unemployment held at 2.0% for the fourth consecutive week.
What Do Worker Flows Tell Us About Cyclical Fluctuations in Employment? from the Federal Reserve Bank of Philadelphia is available here.
| Unemployment Insurance (000s) | 12/14/07 | 12/07/07 | Y/Y | 2006 | 2005 | 2004 |
|---|---|---|---|---|---|---|
| Initial Claims | 346 | 334 | 8.5% | 313 | 331 | 343 |
| Continuing Claims | -- | 2,646 | 6.3% | 2,459 | 2,662 | 2,924 |
by Tom Moeller December 20, 2007
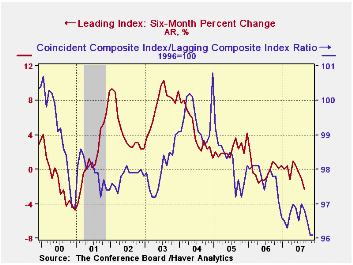
For November, the Conference Board reported that the composite index of leading economic indicators fell by 0.4% after an unrevised 0.5% decline during October. A 0.3% decline had been expected.
During the last ten years there has been a 59% correlation between the y/y change in the leading indicators index and the lagged change in real GDP.
The breadth of one month gain amongst the 10 components of the leading index remained quite low at 30.0%. Over a six month period, the breadth of gain amongst the leaders components was 50% for the third month in a row.
Last month, virtually all of the leader's components fell significantly except hours worked and vendor performance.
The method of calculating the contribution to the leading index from the spread between 10 year Treasury securities and the Fed funds rate has been revised. A negative contribution will now occur only when the spread inverts rather than when declining as in the past. More details can be found here.
The leading index is based on eight previously reported economic data series. Two series, orders for consumer goods and orders for capital goods, are estimated.
The coincident indicators recovered 0.2% after a downwardly revised 0.1% dip in October. Over the last ten years there has been a 86% correlation between the y/y change in the coincident indicators and real GDP growth.
The lagging index rose firmly for the fourth consecutive month due mostly to a higher CPI and higher C&I loans. The ratio of coincident to lagging indicators (a measure of economic excess) was unchanged at the lowest level since 1991.
Visit the Conference Board's site for coverage of leading indicator series from around the world.
| Business Cycle Indicators | November | October | Y/Y | 2006 | 2005 | 2004 |
|---|---|---|---|---|---|---|
| Leading | -0.4% | -0.5% | -0.9% | 1.2% | 2.5% | 7.1% |
| Coincident | 0.2% | -0.1% | 1.7% | 2.5% | 2.1% | 2.0% |
| Lagging | 0.2% | 0.3% | 2.8% | 3.0% | 3.5% | 0.6% |
by Robert Brusca December 20, 2007
Consumer is mostly downbeat throughout main EU nations.
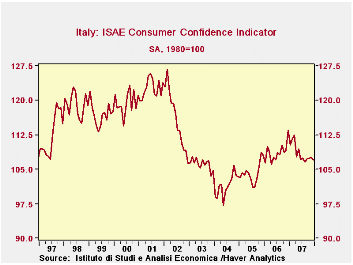
Italy’s consumer confidence fell early in 2007 and has
remained in a narrowed lower range ever since. Despite an ongoing rise
in the Euro and weaker results in other Euro-area economies, in Italy
Consumer confidence has continued to move sideways. Its drop this month
to 107 from 107.6 leaves it near the lower bound of this new range (see
plot above). Confidence is in the bottom third of its range. Italian
consumers are very pessimistic in many respects about the year ahead.
For the next 12 months ahead they rate the overall situation as the
worst in the last 100 months. Unemployment expectations are in the top
13 percent of this range. Consumers rate their financial situation in
the past 12 months as in the bottom 10 percent of its range (worse,
actually 7.5%-tile) and rate the year-ahead prospects as the worst
ever. The environment for household saving is in the top 7% currently
but for the year ahead that slips to the bottom 15 percentile. Major
purchases responses sort of break the mold for unrelenting pessimism,
as consumer feedback rates the past 12 months as being in the 23rd
percentile and the next twelve months improve to the still-poor reading
of the 38th percentile.
The rest of the EU is also experiencing some consumer angst
but not without exception. The indication by GfK that German sentiment
in January may be improving is somewhat shocking in the wake of the
weak euro figures we have been seeing. Insee reports weaker conditions
coming in France featuring concerns about consumer. The weakness in the
UK’s recent CBI retail survey and its outlook for January fits right
in. In Belgium the retail and wholesale sector index just reported a
sharp fall in December. Italy’s consumers have been struggling for some
time. It is hard to know about what the fresh and upbeat German
responses might mean. German consumers have been so negative all year
long and finally they have a Christmas that is far removed from the VAT
hike they spent to avoid last year and that impacted sales patterns so
much early in 2007. One wonders if that is part of what is going on in
Germany. In the rest of the E-zone there seems little evidence of
anything that is upbeat for consumers.
| Italy ISAE Consumer Confidence | ||||||||||
|---|---|---|---|---|---|---|---|---|---|---|
| Since January 1999 | ||||||||||
| Oct 07 |
Sep 07 |
Aug 07 |
Jul 07 |
%tile | Rank | Max | Min | Range | Mean | |
| Consumer Confidence | 107.3 | 107.3 | 106.6 | 107.4 | 34.3 | 61 | 127 | 97 | 30 | 111 |
| Last 12 months | ||||||||||
| OVERALL SITUATION | -67 | -63 | -57 | -59 | 26.2 | 63 | -22 | -83 | 61 | -55 |
| PRICE TRENDS | -23.5 | -26.5 | -25 | -26 | 23.9 | 65 | 4 | -32 | 36 | -16 |
| Next 12months | ||||||||||
| OVERALL SITUATION | -33 | -30 | -29 | -25 | 1.7 | 99 | 24 | -34 | 58 | -13 |
| PRICE TRENDS | 26 | 31 | 22.5 | 18.5 | 45.2 | 43 | 49 | 7 | 42 | 23 |
| UNEMPLOYMENT | 2 | -2 | 0 | -3 | 82.1 | 12 | 9 | -30 | 39 | -6 |
| HOUSEHOLD BUDGET | 6 | 5 | 7 | 4 | 20.6 | 85 | 33 | -1 | 34 | 14 |
| HOUSEHOLD FIN SITUATION | ||||||||||
| Last 12 months | -44 | -39 | -37 | -34 | 7.5 | 96 | -7 | -47 | 40 | -29 |
| Next12 months | -14 | -13 | -10 | -10 | 0.0 | 100 | 14 | -14 | 28 | -1 |
| HOUSEHOLD SAVINGS | ||||||||||
| Current | 58 | 54 | 55 | 54 | 97.4 | 2 | 59 | 20 | 39 | 38 |
| Future | -42 | -33 | -35 | -34 | 0.0 | 100 | -9 | -42 | 33 | -23 |
| MAJOR Purchases | ||||||||||
| Current | -45 | -42 | -41 | -39 | 28.6 | 54 | -15 | -57 | 42 | -40 |
| Future | -66 | -65 | -68 | -68 | 22.6 | 65 | -42 | -73 | 31 | -62 |
| Total number of months: | 100 | |||||||||
by Robert Brusca December 20, 2007
…points lower for E-zone readings to come.
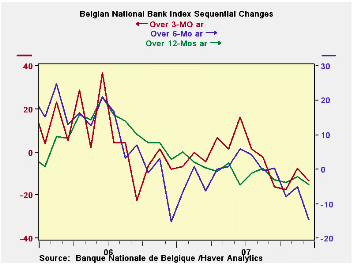
The Belgian National bank releases its barometer indices ahead
of the EU each month. The Belgian indices turn out to be harbingers of
the EU releases to come. While Belgium is a small European country it
is right in the middle of the Zone and its trends in commerce tend to
mimic those of the Zone itself and of Germany. In December the rise in
the total industry index has given way to drop a decline. MFG has
posted larger drop. The wholesale/retail sector reading is suddenly
sharply lower. It would be a very bad sign if the EU and German indices
were turn as sharply as the Belgian sector index has. Construction also
has turned negative after posting a reasonably strong reading for two
months in a row.
| Belgium National Bank Indices | ||||||
|---|---|---|---|---|---|---|
| Dec-07 | Nov-07 | Oct-07 | 3-Mo Change | 6-Mo Change | 12-Mo Change | |
| Total Industry | -1.9 | 1.4 | -0.1 | -3.4 | -7.4 | -4.4 |
| Manufacturing | -1.8 | -0.5 | -1.8 | -3.2 | -8.3 | -4.2 |
| Production | 4.0 | 1.0 | -1.0 | 4.0 | -4.0 | 3.0 |
| Domestic Orders | -4.0 | 6.0 | -3.0 | -1.0 | -9.0 | -7.0 |
| Foreign Orders | 4.0 | 2.0 | 3.0 | -4.0 | -7.0 | -1.0 |
| Prices | -1.0 | 2.0 | 3.0 | -4.0 | -14.0 | -12.0 |
| Current assessments | ||||||
| Total Orders | -3.0 | -4.0 | -6.0 | -1.0 | -6.0 | -7.0 |
| Foreign Orders | -3.0 | -5.0 | -5.0 | -4.0 | -7.0 | -3.0 |
| Inventories | 6.0 | 5.0 | 2.0 | 7.0 | 13.0 | 5.0 |
| Wholesales & Retail | -3.3 | 8.2 | 6.7 | -3.3 | -7.5 | -1.3 |
| Construction | -0.7 | 3.7 | 1.0 | -4.1 | -3.0 | -8.4 |
| Business Services | #N/A | 12.8 | 12.8 | #N/A | #N/A | #N/A |
| Comparisons: | Changes lag one month | |||||
| EU Index: Industry | #N/A | 3.0 | 2.0 | -2.0 | -2.0 | -3.0 |
| Germany Index: Industry | #N/A | 3.0 | 3.0 | -5.0 | -5.0 | -8.0 |
| Compare: BNB Index | -- | -- | -- | -1.9 | -2.8 | -2.1 |

Tom Moeller
AuthorMore in Author Profile »Prior to joining Haver Analytics in 2000, Mr. Moeller worked as the Economist at Chancellor Capital Management from 1985 to 1999. There, he developed comprehensive economic forecasts and interpreted economic data for equity and fixed income portfolio managers. Also at Chancellor, Mr. Moeller worked as an equity analyst and was responsible for researching and rating companies in the economically sensitive automobile and housing industries for investment in Chancellor’s equity portfolio. Prior to joining Chancellor, Mr. Moeller was an Economist at Citibank from 1979 to 1984. He also analyzed pricing behavior in the metals industry for the Council on Wage and Price Stability in Washington, D.C. In 1999, Mr. Moeller received the award for most accurate forecast from the Forecasters' Club of New York. From 1990 to 1992 he was President of the New York Association for Business Economists. Mr. Moeller earned an M.B.A. in Finance from Fordham University, where he graduated in 1987. He holds a Bachelor of Arts in Economics from George Washington University.
More Economy in Brief


