 Global| Jul 27 2007
US 2Q 2007 GDP Above Expectations
by:Tom Moeller
|in:Economy in Brief
Summary
U.S. real GDP grew 3.4% (AR) last quarter. It was both the fastest growth since 1Q06 and exceeded Consensus expectations for a 3.2% rise. The estimates released today reflect the annual revision to the national income & product [...]

 An improved net export deficit added 1.6 percentage points to GDP growth. It occurred as exports boomed 6.4% (6.8% y/y) while imports fell 2.6% (+2.0% y/y).
Somewhat faster inventory accumulation added 0.2 percentage points to 2Q GDP after subtracting from GDP during the prior two quarters.
An improved net export deficit added 1.6 percentage points to GDP growth. It occurred as exports boomed 6.4% (6.8% y/y) while imports fell 2.6% (+2.0% y/y).
Somewhat faster inventory accumulation added 0.2 percentage points to 2Q GDP after subtracting from GDP during the prior two quarters.
The GDP chain price index rose 2.7% versus expectations for a 3.4% rate of gain. Growth in the PCE chain price index rose to 4.3% (2.3% y/y) due to a 10.0% jump in nondurables boosted by higher fuel costs. Less food & energy the PCE chain price index grew 1.4% (2.0% y/y), its slowest rate of increase since 2003.
| Chained 2000$, % AR | 2Q 2007 | 1Q 2007 | Y/Y | 2006 | 2005 | 2004 |
|---|---|---|---|---|---|---|
| GDP | 3.4% | 0.6% | 1.8% | 2.9% | 3.1% | 3.6% |
| Inventory Effect | 0.2% | -0.7% | -0.7% | 0.1% | -0.2% | 0.3% |
| Final Sales | 2.2% | 1.9% | 3.5% | 2.8% | 3.3% | 3.3% |
| Foreign Trade Effect | 1.6% | -0.2% | 0.8% | 0.1% | 0.0% | -0.5% |
| Domestic Final Demand | 1.7% | 1.6% | 1.7% | 2.7% | 3.3% | 3.8% |
| Chained GDP Price Index | 2.7% | 4.2% | 2.7% | 3.2% | 3.2% | 2.9% |
by Tom Moeller July 27, 2007

The University of Michigan's reading of consumer sentiment this month rose 6.0% to 90.4, the highest level since February. The increase was less than the 8.3% gain reported in the preliminary report and it fell short of Consensus expectations for a reading of 91.5.
Consumer expectations contributed to the rise with a 9.1% jump m/m.
An improved expectation for business conditions during the next year contributed with an 11.7% m/m rise and an improved outlook for the next five years contributed with a 9.1% jump. Both these increases were much reduced from the preliminary report. 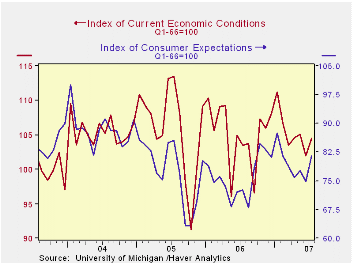
An improved view of the current economic conditions contributed as it rose 2.6%. The view of current personal finances rose 4.5% (4.5% y/y) but the perspective of current buying conditions rose just 1.3% (-1.3% y/y).
The assessment of government policy improved 4.9% (4.9% y/y) after falling sharply during the prior two months.
The University of Michigan survey is not seasonally adjusted.The reading is based on telephone interviews with about 500 households at month-end.
| University of Michigan | July | July (Prelim.) | July y/y | June | 2006 | 2005 |
|---|---|---|---|---|---|---|
| Consumer Sentiment | 90.4 | 92.4 | 6.7% | 85.3 | 87.3 | 88.6 |
| Current Conditions | 104.5 | 105.7 | 1.0% | 101.9 | 105.1 | 105.9 |
| Expectations | 81.5 | 83.9 | 12.4% | 74.7 | 75.9 | 77.4 |
by Carol Stone July 27, 2007

It was looking promising in Japan: deflation was ending, finally, after almost 8 years. The most watched measure there, the core CPI excluding fresh food, had fallen from the middle of 1998 through April of 2006, according to the path of the year-over-year percent change. The overall amount of deflation wasn't all that bad: the index, seasonally adjusted, fell from a high of 103.4 in mid-1997 to a low of 99.9 in several months of 2005. But it was promising to see the index bottom out and begin to rise. The latter months of last year didn't see any big increase, but it really seemed that retailers were regaining some pricing power, necessary for the economy to sustain a self-reinforcing expansion.
But prices have not been able to sustain this new uptrend. This specific measure, the General CPI excluding fresh food has been down year-on-year since February, and today, the Ministry of Internal Affairs and Communications reported that June was a fifth consecutive month of decline, 0.1% from June 2006. This core index level is the blue line in the first graph.
The green line in that graph is a Western-style core index, the total less all food and energy. It highlights that the "recovery" we thought we saw in the other index was really concentrated in energy and that other prices continued down. The rate of decline eased in this index, but the year-on-year rate has never turned positive.
The June data show continuing weakness in housing, especially imputed rents, household furnishings, communications and reading & recreation. Clothing and vehicle prices and public transportation charges have been edging marginally higher. Medical care and the "miscellaneous" category are up somewhat, the latter due mainly to an administered increase in tobacco prices.
With consumer prices unable to increase, it doesn't really seem surprising that retail sales have not risen either. The Ministry of Economy, Trade and Industry (METI) today reported a monthly decline of 0.8% for June, and a year-on-year reduction of 0.4%. Stores did have rising sales from 2003 through the middle of last year, a period when prices were falling. So price behavior isn't the only determinant. Individual store categories are showing mixed performances, with general merchandise outlets having persistent gains. But clothing stores saw notable drops in June, and motor vehicle dealers more than reversed a good April increase in May and June. Household appliance stores, facing a downtrend in home furnishings prices, have also been experiencing declining sales.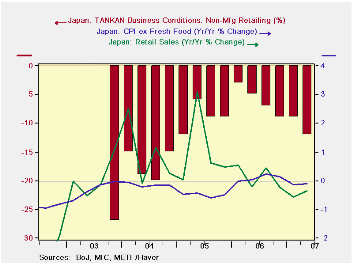
At the beginning of this month, the fabled TANKAN survey indicated that businesses were more optimistic in Q2. While this is generally true, the assessments of retailers have diminished. For "all enterprises" in retailing, the "actual conditions" measure turned weaker in Q2 2006 and has continued to deteriorate since, along with both prices and sales. Sigh.
| JAPAN | June 2007* | May 2007* | Apr 2007* | Year/ Year | 2006 | 2005 | 2004 |
|---|---|---|---|---|---|---|---|
| CPI, General | -0.1 | 0.2 | 0.2 | -0.2 | 0.2 | -0.3 | 0.0 |
| CPI ex Fresh Food | 0.0 | 0.1 | 0.1 | -0.1 | 0.1 | -0.1 | -0.1 |
| CPI ex Food & Energy | -0.1 | -0.1 | 0.1 | -0.4 | -0.4 | -0.4 | -0.6 |
| Retail Sales | -0.8 | 0.6 | 0.3 | -0.4 | 0.1 | 1.0 | 1.0 |

Tom Moeller
AuthorMore in Author Profile »Prior to joining Haver Analytics in 2000, Mr. Moeller worked as the Economist at Chancellor Capital Management from 1985 to 1999. There, he developed comprehensive economic forecasts and interpreted economic data for equity and fixed income portfolio managers. Also at Chancellor, Mr. Moeller worked as an equity analyst and was responsible for researching and rating companies in the economically sensitive automobile and housing industries for investment in Chancellor’s equity portfolio. Prior to joining Chancellor, Mr. Moeller was an Economist at Citibank from 1979 to 1984. He also analyzed pricing behavior in the metals industry for the Council on Wage and Price Stability in Washington, D.C. In 1999, Mr. Moeller received the award for most accurate forecast from the Forecasters' Club of New York. From 1990 to 1992 he was President of the New York Association for Business Economists. Mr. Moeller earned an M.B.A. in Finance from Fordham University, where he graduated in 1987. He holds a Bachelor of Arts in Economics from George Washington University.
More Economy in Brief


