 Global| Jul 14 2009
U.S. 'YTD Budget Deficit Broaches$1 Trillion
by:Tom Moeller
|in:Economy in Brief
Summary
The U.S. government ran a budget deficit of $94.3 billion last month pulling the deficit during the first nine months of this fiscal year to $1.1 trillion. That compares to a deficit of $286 billion during the first nine months of [...]
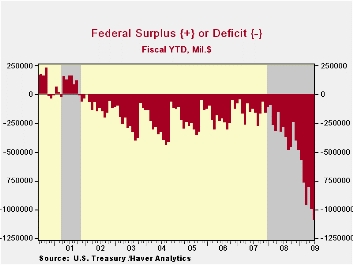 The U.S.
government ran a budget deficit of $94.3 billion last month pulling the
deficit during the first nine months of this fiscal year to $1.1
trillion. That compares to a deficit of $286 billion during the first
nine months of last year when the 2008 deficit totaled $454.8 billion.
Year-to-date the budget deficit is running at roughly 7.7% of GDP. The
Congressional Budget Office's recent deficit estimate of $1.7 trillion
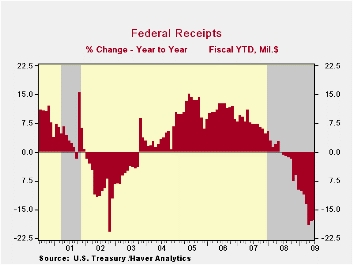
for FY09 amounts to 11.9% of GDP.· Net revenues during the first nine
months of FY09 were down 17.9% y/y. Individual income tax receipts fell
21.9% y/y through June reflecting higher unemployment. Corporate tax
receipts mirror the drying up of profitability and fell by more than
one-half. Employment taxes fell for the first time since 2003 and were
down by 0.2% and unemployment insurance tax receipts fell 6.2%. Estate
& gift taxes fell 17.4% after 13.6% growth last year.
The U.S.
government ran a budget deficit of $94.3 billion last month pulling the
deficit during the first nine months of this fiscal year to $1.1
trillion. That compares to a deficit of $286 billion during the first
nine months of last year when the 2008 deficit totaled $454.8 billion.
Year-to-date the budget deficit is running at roughly 7.7% of GDP. The
Congressional Budget Office's recent deficit estimate of $1.7 trillion
for FY09 amounts to 11.9% of GDP.· Net revenues during the first nine
months of FY09 were down 17.9% y/y. Individual income tax receipts fell
21.9% y/y through June reflecting higher unemployment. Corporate tax
receipts mirror the drying up of profitability and fell by more than
one-half. Employment taxes fell for the first time since 2003 and were
down by 0.2% and unemployment insurance tax receipts fell 6.2%. Estate
& gift taxes fell 17.4% after 13.6% growth last year.
 Swelled
by TARP, U.S. government outlays surged by 20.5% from last fiscal
year's first nine months. Outlays under the Government's Troubled Asset
Relief Program (TARP) amounted to a much-reduced $11.3B last month but
for the first nine months of the program totaled $318.8B. The U.S.
Treasury has adopted the view that these TARP expenditures should be
counted like any other spending. When the banks repay the Treasury,
these funds will be counted as revenue. Accounted for in this way, TARP
causes a surge in the budget deficit when the funds are distributed to
the banks, but leads to a smaller deficit, or perhaps a surplus, when
repayments are received.
Swelled
by TARP, U.S. government outlays surged by 20.5% from last fiscal
year's first nine months. Outlays under the Government's Troubled Asset
Relief Program (TARP) amounted to a much-reduced $11.3B last month but
for the first nine months of the program totaled $318.8B. The U.S.
Treasury has adopted the view that these TARP expenditures should be
counted like any other spending. When the banks repay the Treasury,
these funds will be counted as revenue. Accounted for in this way, TARP
causes a surge in the budget deficit when the funds are distributed to
the banks, but leads to a smaller deficit, or perhaps a surplus, when
repayments are received.
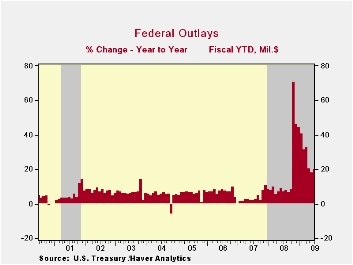 Defense
spending (19% of total outlays) rose
16.2% fiscal year-to-date. Medicare expenditures (12% of outlays)
nearly doubled and "income security" spending (11% of outlays) jumped
20.6% after 7.5% growth last year. Social security payments rose an
elevated 9.1% but net interest payments continued to fall by nearly
one-third with lower interest rates.
Defense
spending (19% of total outlays) rose
16.2% fiscal year-to-date. Medicare expenditures (12% of outlays)
nearly doubled and "income security" spending (11% of outlays) jumped
20.6% after 7.5% growth last year. Social security payments rose an
elevated 9.1% but net interest payments continued to fall by nearly
one-third with lower interest rates.
The Government's financial data are available in Haver's USECON database, with extensive detail available in the specialized GOVFIN.· The Economic Crisis and the Fiscal Crisis: 2009 and Beyond from Alan J. Auerbach, University of California, Berkeley, and William G. Gale, Brookings Institution, is available here.
| US Government Finance | June | May | Y/Y | FY 2008 | FY 2007 | FY 2006 |
|---|---|---|---|---|---|---|
| Budget Balance | -94.3B | $-189.7B | $33.5B (6/08) |
-$454.8B | -$161.5B | -$248.2B |
| Net Revenues | $215.4B | $17.2B | -17.1% | -1.7% | 6.7% | 11.8% |
| Net Outlays | $309.7B | $306.9B | 36.8% | 9.1% | 2.8% | 7.4% |
by Tom Moeller July 14, 2009
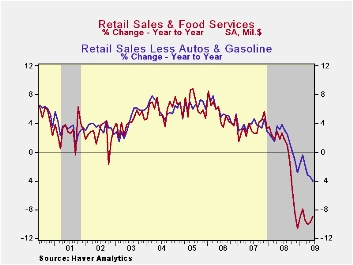
Weak job growth and rising gasoline prices continued last month to constrain consumer spending. A 0.6% increase in June retail sales was near expectations and followed a little-revised 0.5% gain during May. However, except for a rise in gasoline prices and a modest gain in auto sales, consumer spending slipped for the third straight month. The retail sales data are available in Haver's USECON database.
Auto sales did manage a 2.3% increase (-14.1% y/y) in dollar terms despite a slight decline in unit vehicle sales during the month. Without the auto sector, retail sales increased a modest 0.3%.
The latest retail sales figures have been dominated by higher
prices for gasoline. Last month, sales of gasoline service stations
jumped 5.0%, the same as they did during May. (Lower prices versus last
year, however, did cause sales to fall by nearly one-third versus
2008.) The June gasoline sales gain was driven by a 16.1% (NSA) rise in
the retail price for a gallon of gasoline to $2.63 per gallon.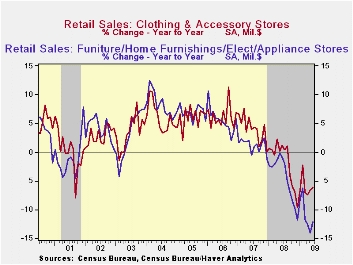
Emphasizing the persistent weakness in underlying consumer spending were retail sales excluding both autos and gasoline. They fell 0.2% (-4.0% y/y) last month for the fourth consecutive monthly decline. These sales have risen just at a 1.1% annual rate since December following last year's 2.8% 12-month decline.
Further evidence that discretionary spending remains under pressure was the slight 0.4% increase in sales at furniture, electronics & appliance stores (-12.0% y/y) which followed declines during the three prior months. Furniture store sales alone ticked up 0.2% (-12.6% y/y) while sales of electronics & appliances made up their May decline with a 0.9% increase (-11.5% y/y). So far this year, these sales have fallen at a 5.2% annual rate after last year's 4.5% decline. In the soft goods area, apparel store sales were unchanged (-6.2% y/y) while sales at general merchandise stores fell 0.4% for the fourth consecutive monthly decline (-3.0% y/y).
For the first month in five, internet and catalogue purchases rose. June sales of non-store retailers gained 0.6% (-6.7% y/y), after rising 2.8% in 2008 and 7.1% during 2007. Adding to the gloom, restaurant sales declined 0.9% last month, tempering restaurant sales gains so far this year to a 3.3% annual rate.
Building materials sales in fell 0.9% last month and they were down at a 7.4% annual rate since December.
Recourse and Residential Mortgage Default: Theory and Evidence from U.S. States from the Federal Reserve Bank of Richmond can be found here.
| June | May | April | Y/Y | 2008 | 2007 | 2006 | |
|---|---|---|---|---|---|---|---|
| Retail Sales & Food Services (%) | 0.6 | 0.5 | -0.3 | -9.0 | -0.7 | 3.3 | 5.3 |
| Excluding Autos | 0.3 | 0.4 | -0.3 | -7.9 | 2.5 | 3.9 | 6.3 |
| Less Gasoline | -0.2 | -0.1 | -0.3 | -4.0 | 1.6 | 3.6 | 5.7 |
by Tom Moeller July 14, 2009
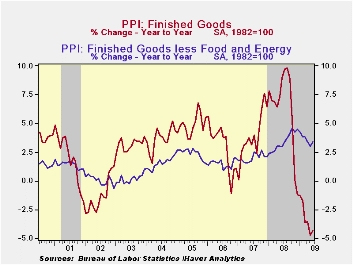
The economic recession may be restraining pricing power generally, but not last month. The PPI for finished goods jumped 1.8% after a 0.2% uptick during May. Consensus expectations had been for a 0.9% increase. The real news, however, was that some of this pricing strength bled over and raised core pricing power. The PPI less food & energy rose 0.5%, the strongest gain since October.
Higher energy prices, up 6.6% m/m, led the strength in last
month's PPI. The rise did not, however, recoup much of energy's earlier
weakness so y/y prices were still down by one quarter. The June gain
was led by an 18.5% pop in gasoline prices but they were still off
37.9% y/y. Natural gas prices also were firm last month and rose 2.5%
(-27.1% y/y).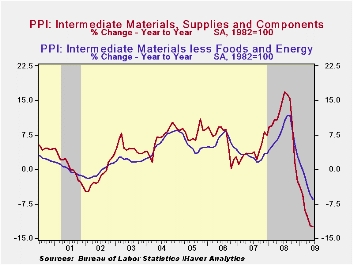
The PPI for finished consumer goods less food & energy was strong and posted a 0.5% (3.8% y/y) gain. It was the strongest increase since October and was led by a 0.9% (3.5% y/y) gain in durables prices. Core nondurable price gains have been weakening, however, and were up just 0.1%. The y/y gain of 3.9% is off its peak of 5.9% reached last fall. Capital equipment prices also firmed by 0.5% (2.7% y/y) after five months during which they were unchanged.
Prices for intermediate goods also moved higher by 1.9% due to
higher energy prices. Food prices also were firm for the third straight
month. Less food & energy, intermediate goods prices posted the
first increase since last September. Nevertheless, the 0.4% rise left
core prices down a record 6.5% y/y.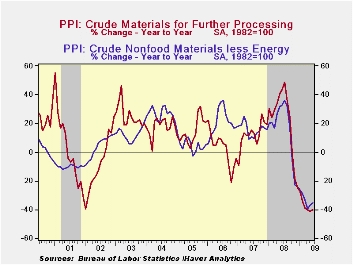
The crude materials PPI rose for a third month led by a 10.9% rise in crude energy prices. Despite this increase, however, crude energy prices remained down by more than one-half from the year ago level. Finished food prices reversed their May increase. They fell 0.4% and the decline left them down by 20.9% from last year. Core pricing power at the crude level also improved and posted a 2.6% increase. That was the third consecutive monthly increase and further indicative of improvement in factory sector activity.
The Producer Price Index data is available in Haver's USECON database. More detailed data is in the PPI and in the PPIR databases.
| Producer Price Index (%) | June | May | Y/Y | 2008 | 2007 | 2006 |
|---|---|---|---|---|---|---|
| Finished Goods | 1.8 | 0.2 | -4.3 | 6.4 | 3.9 | 2.9 |
| Core | 0.5 | -0.1 | 3.4 | 3.4 | 2.0 | 1.5 |
| Intermediate Goods | 1.9 | 0.3 | -12.4 | 10.5 | 4.0 | 6.4 |
| Core | 0.4 | -0.2 | -6.5 | 7.4 | 2.8 | 6.0 |
| Crude Goods | 4.6 | 3.6 | -40.2 | 21.4 | 11.9 | 1.4 |
| Core | 2.6 | 6.7 | -35.4 | 14.8 | 15.6 | 20.8 |
by Tom Moeller July 14, 2009
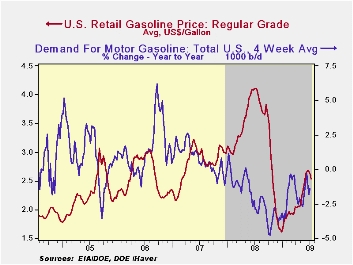
The loss of forward momentum in the U.S. economy continued to weaken prices in the energy market. Yesterday, the cash market price for a gallon of regular gasoline fell to $1.60 versus the daily high of $2.04 reached in the middle of June. Retail gas prices also have moved lower. The pump price for regular gasoline fell last week to an average $2.53 per gallon, down sixteen cents from the high. Nevertheless prices remained up by nearly one dollar from the December low and were at the highest level since late-October. The figures are reported by the U.S. Department of Energy and can be found in Haver's WEEKLY & DAILY databases.
Lower crude oil prices have led the
decline in refined product prices. Yesterday the one-month futures
price for light sweet crude oil dropped to $59.69 from an average
$61.48 last week. Prices had reached a daily high of $72.68.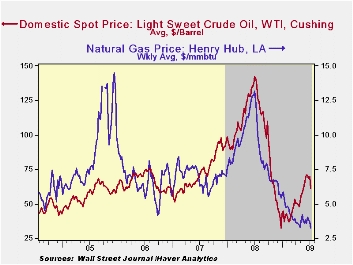
The weakness in energy prices is against the backdrop of soft demand. The ongoing recession reduced the demand for motor gasoline by 1.4% y/y during the last four weeks. The rate of decline has moderated from the 4.8% shortfall this past autumn. Demand for distillate also is off sharply though residual fuel oil demand has moved higher. Finally, oil remains plentiful as evidenced by a 14.4% y/y rise in inventories of crude oil & petroleum products. The figures on crude oil inventories are available in Haver's OILWKLY database.
Natural gas prices fell to a new seven-year low. Last week's average price of $3.28 per mmbtu (-73.2% y/y) was down from a recent high of $4.02. Current prices are down by three-quarters from the high reached in early-July of $13.19/mmbtu.
| Weekly Prices | 07/13/09 | 07/06/09 | Y/Y | 2008 | 2007 | 2006 |
|---|---|---|---|---|---|---|
| Retail Regular Gasoline ($ per Gallon, Regular) | 2.53 | 2.61 | -38.5% | 3.25 | 2.80 | 2.57 |
| Light Sweet Crude Oil, WTI ($ per bbl.) | 61.48 | 69.36 | -56.1% | 100.16 | 72.25 | 66.12 |
by Tom Moeller July 14, 2009
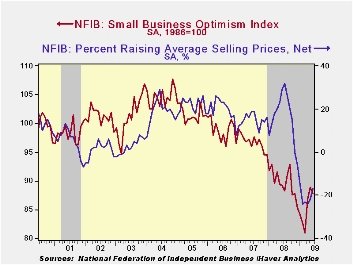
According to the National Federation of Independent Business (NFIB), small business optimism slipped last month from May but the index level of 87.8 still was its highest level since last November. Optimism remained down 1.6% from last year.
During the last ten years there has been a 49% correlation between the level of the NFIB index and the two-quarter change in real GDP.
The percentage planning to raise employment remained slightly negative but was at its highest level since October. The percentage of respondents with one or more job openings improved modestly to 11% but that was still near the least since 1982. During the last ten years there has been a 71% correlation between the NFIB employment percentage and the y/y change in nonfarm payrolls.
The latest rise in the overall index occurred as the percentage expecting the economy to improve slipped to 7% but that was the third consecutive month in positive territory. The percentage expecting credit conditions to ease remained in its recent range while the percentage reporting that now is a good time to expand the business slipped but also remained positive. During the next 3-6 months, plans for capital spending also remained range-bound and modestly positive.
The largest, single most important problems seen by business
were poor sales (32%), taxes (19%), government requirements (15%),
insurance cost and availability (7%), competition from large businesses
(6%) and inflation (5%).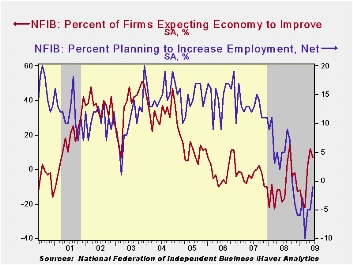
The percentage of firms planning to raise prices rose slightly to 5% but that still was near the record low. Though the figure improved modestly, the percentage of firms actually raising prices remained in negative territory near the record low. During the last ten years there has been a 69% correlation between the y/y change in the producer price index and the level of the NFIB price index.
About 24 million businesses exist in the United States. Small business creates 80% of all new jobs in America.
The NFIB figures can be found in Haver's SURVEYS database.
| Nat'l Federation of Independent Business | June | May | Y/Y | 2008 | 2007 | 2006 |
|---|---|---|---|---|---|---|
| Small Business Optimism Index (SA, 1986=100) | 87.8 | 88.9 | -1.6% | 89.8 | 96.7 | 98.9 |
by Louise Curley July 14, 2009
German investors and analysts have become somewhat less
positive about the economic outlook, six months ahead. In the July
survey of the financial community by the ZEW institute, the excess of
optimists over pessimists regarding the economic outlook dropped to
39.5% from 44.8% in June. It is not surprising that some of the
participants in the survey may be becoming more cautious about the
recovery after the rapid decline of pessimists and the rapid rise of
optimists that has taken place since the low of last July. The swing
from the majority of pessimists in July 2008 to the majority of
optimists in June was 108.7 percentage points. With the decline in
optimists in July, the swing is still large at 103.4 percentage points.
Moreover, the July excess of optimists of 39.5 % is still well above
the long term average of 26.3%.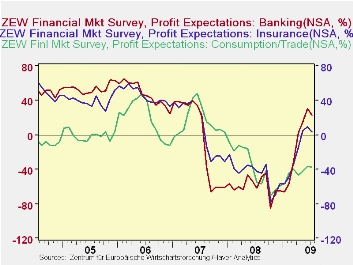
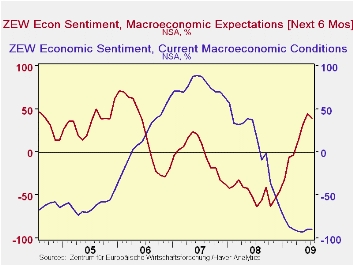
Pessimists in the financial community continue to dominate the optimists regarding the current economic situation. In July, although slightly improved from the June figure of 89.7%, the excess of pessimists was 89.3%. Expectations and appraisals of current conditions are shown in the first chart.
Among the factors that may have influenced the participants in
the July ZEW survey are their profit expectations. In the July survey,
they expect a detererioration in profits for the banking and insurance
industries, the first deterioration since January, 2009. 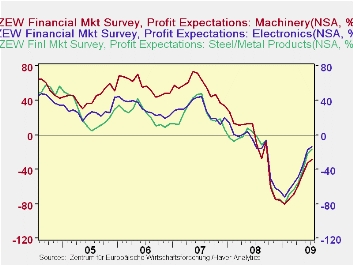 While the
expectations of profits in the producing industries, such as machinery,
metals/steel and electronics are expected to show some improvement,
profits in consumption and trade are expected to decline slightly.
Profit expectations that are expected to increase and those that are
expected to decrease are shown in the second and third charts.
While the
expectations of profits in the producing industries, such as machinery,
metals/steel and electronics are expected to show some improvement,
profits in consumption and trade are expected to decline slightly.
Profit expectations that are expected to increase and those that are
expected to decrease are shown in the second and third charts.
| ZEW SURVEY (Percent Balances ex where noted) | July 09 | June 09 | July 08 | M/M Chg | Y/Y Chg | 2008 | 2007 | 2006 |
|---|---|---|---|---|---|---|---|---|
| Expectations | 39.5 | 44.8 | -63.9 | -5.3 | 103.4 | -47.5 | -30 | 22.3 |
| Current Conditions | -89.3 | -89.7 | -17.0 | 0.4 | -106.3 | 7.3 | 75.9 | 18.3 |
| Profit Expectations | July 09 | June 09 | May 09 | Apr 09 | Mar 09 | Feb 09 | Jan 09 | |
| Banking | 22.0 | 30.8 | 15.1 | 2.0 | -31.6 | -55.7 | -65.7 | -- |
| Insurance | 3.2 | 9.7 | 5.1 | -15.1 | -34.2 | -49.0 | -56.5 | -- |
| Consumption | -37.4 | -36.6 | -42.1 | -46.0 | -40.2 | -44.3 | -56.2 | -- |
| Metal/Steel | -16.0 | -22.3 | -41.5 | -55.1 | -64.1 | -69.3 | -80.1 | -- |
| Machinery | -28.4 | -32.5 | -45.6 | -58.5 | -69.4 | -74.6 | -80.1 | -- |
| Electronics | -13.7 | -17.3 | -36.0 | -48.9 | -57.2 | -64.0 | -72.2 | -- |

Tom Moeller
AuthorMore in Author Profile »Prior to joining Haver Analytics in 2000, Mr. Moeller worked as the Economist at Chancellor Capital Management from 1985 to 1999. There, he developed comprehensive economic forecasts and interpreted economic data for equity and fixed income portfolio managers. Also at Chancellor, Mr. Moeller worked as an equity analyst and was responsible for researching and rating companies in the economically sensitive automobile and housing industries for investment in Chancellor’s equity portfolio. Prior to joining Chancellor, Mr. Moeller was an Economist at Citibank from 1979 to 1984. He also analyzed pricing behavior in the metals industry for the Council on Wage and Price Stability in Washington, D.C. In 1999, Mr. Moeller received the award for most accurate forecast from the Forecasters' Club of New York. From 1990 to 1992 he was President of the New York Association for Business Economists. Mr. Moeller earned an M.B.A. in Finance from Fordham University, where he graduated in 1987. He holds a Bachelor of Arts in Economics from George Washington University.
More Economy in Brief


