 Global| Apr 08 2009
U.S. Weekly Mortgage ApplicationsJump Higher As Refi's More Than Double
by:Tom Moeller
|in:Economy in Brief
Summary
The Mortgage Bankers Association reported another increase in mortgage applications. The 4.7% w/w increase last week pulled them up by nearly three-quarters from the year ago level and to nearly their highest for this year. Fueled by [...]
 The Mortgage
Bankers Association reported another increase in mortgage applications.
The 4.7% w/w increase last week pulled them up by nearly three-quarters
from the year ago level and to nearly their highest for this year.
The Mortgage
Bankers Association reported another increase in mortgage applications.
The 4.7% w/w increase last week pulled them up by nearly three-quarters
from the year ago level and to nearly their highest for this year.
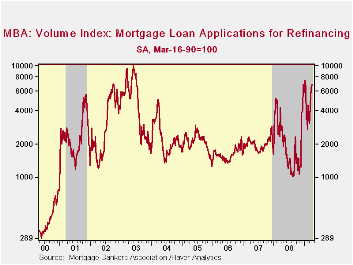
Fueled by lower interest rates, the index of applications to refinance a home mortgage again rose. The moderate 3.2% w/w increase pulled them up by more than double the year ago level.
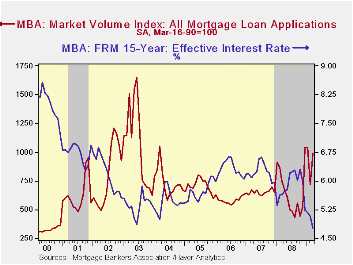
Returning to the 2003 low,
the effective interest rate on a conventional 15-year mortgage fell to
4.73% week-to-week. For a 30-year mortgage, rates held near their
recent lows at 4.93%. Interest rates on 15- and 30-year mortgages are
closely correlated (>90%) with the rate on 10-year Treasury
securities.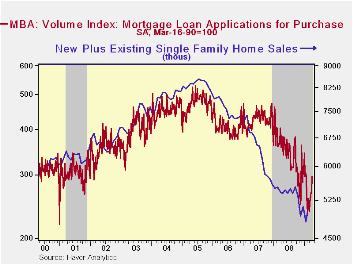 For an adjustable 1-Year mortgage the rate has been fairly
stable this year near 6.25% but the rate still was down sharply from
the 7.07% peak reached this past Fall.
For an adjustable 1-Year mortgage the rate has been fairly
stable this year near 6.25% but the rate still was down sharply from
the 7.07% peak reached this past Fall.
Mortgage applications for purchase also rose last week, but the 11.5% w/w gain still left them down by one-quarter from last year. Nevertheless, some sign of life in home purchases may be evident in a 25% increase in applications from the absolute lows of this past February. That life, however, has yet to translate into material gains in the home sales figures. Sales of new plus existing single family homes in February only recovered a sharp January decline. They remained near the cycle low and near the lowest since 1997.
During the last ten years there has been a (negative) 79% correlation between the level of applications for purchase and the effective interest rate on a 30-year mortgage. Moreover, during the last ten years there has been a 61% correlation between the y/y change in purchase applications and the change in new plus existing single family home sales.
 The
figures
for weekly mortgage applications are available in Haver's SURVEYW
database.
The
figures
for weekly mortgage applications are available in Haver's SURVEYW
database.
The Mortgage Bankers Association surveys between 20 to 35 of the top lenders in the U.S. housing industry to derive its refinance, purchase and market indexes. The weekly survey covers roughly 50% of all U.S. residential mortgage applications processed each week by mortgage banks, commercial banks and thrifts. Visit the Mortgage Bankers Association site here.
Recession or depression? from the Federal Reserve Bank of St. Louis is available here.
Explaining trends in wages, work and occupations from the Federal Reserve Bank of Chicago can be found here.
| MBA Mortgage Applications (3/16/90=100) | 04/03/09 | 03/27/09 | Y/Y | 2008 | 2007 | 2006 |
|---|---|---|---|---|---|---|
| Total Market Index | 1,250.6 | 1,194.4 | 72.4% | 642.9 | 652.6 | 584.2 |
| Purchase | 297.7 | 268.0 | -22.6% | 345.4 | 424.9 | 406.9 |
| Refinancing | 6,813.5 | 6,600.1 | 150.1% | 2,394.1 | 1,997.9 | 1,634.0 |
by Robert Brusca April 8, 2009
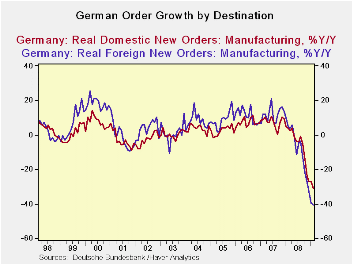 The
growth rates for German industrial orders are not getting
progressively worse, but they still are bad and the three-month growth
rate still is worse than the six month growth rate. There may be a hint
or whiff of slowing down the pace of the order decline, but it’s a
vague hint. Over THREE MONTHS the pace of order decline in real terms
is -51.5% led by a 60.2% pace of decline in foreign orders and a lesser
but still severe 39.3% pace of decline in new domestic orders.
The
growth rates for German industrial orders are not getting
progressively worse, but they still are bad and the three-month growth
rate still is worse than the six month growth rate. There may be a hint
or whiff of slowing down the pace of the order decline, but it’s a
vague hint. Over THREE MONTHS the pace of order decline in real terms
is -51.5% led by a 60.2% pace of decline in foreign orders and a lesser
but still severe 39.3% pace of decline in new domestic orders.
The pace of order decline in the current quarter annualized is
just about the same as the pace in 2008-Q4. Meanwhile real sector sales
continue to drop at a steadily accelerating pace. Capital goods
declines lead the parade over three-months, six months and twelve
months.
These sorts of declines cannot go on for very long without
bringing disaster. It is reasonable to think we are on the cusp of
seeing a slowdown in the rate of unravel. There are some stimulus
programs afoot in Europe. But just as clearly the Euro-view and the ECB
view has been to be less helpful than the view from the authorities in
the US. In global terms these ‘guys’ are intending to piggy-back a bit
on US generated stimulus.
I was shocked to see how blasé Europe really is when Juergen
Stark of the ECB was disapproving of the extension of IMF credit. We
are in the middle of a real financial and growth problem. And Stark was
not pleased to get some help that would be channeled to the neediest.
Without this help, recession would hit less developed and smaller
nations harder; they would have to wait for the larger economies to
pick up in order to benefit. Europe is not doing that every quickly, as
we just observed, above. In the case of Europe the biggest risk is in
Eastern Europe and there the EU has taken some special steps to provide
assistance. This recession has been a good case study in how nations
‘take care of their own’. But the IMF money which is less that way and
is geared more toward need without bilateral strings attached is very
helpful and timely. I do not share the Stark/ECB reluctance.
For now the German data on industrial orders tell us that
Europe is weakening at a rapid pace. German domestic demand may be
faring a tad better as it spins off the vaguest hint of slowing its
descent. But for foreign orders the assessment for German data remains
quite bleak.
| German Orders and Sales By Sector and Origin | ||||||||
|---|---|---|---|---|---|---|---|---|
| Real and SA | % M/M | % Saar | ||||||
| Feb-09 | Jan-09 | Dec-08 | 3-MO | 6-Mo | 12-Mo | Yr Ago | QTR-2-Date | |
| Total Orders | -3.5% | -6.7% | -7.3% | -51.5% | -30.4% | -36.3% | 4.4% | -54.5% |
| Foreign | -1.3% | -10.9% | -9.7% | -60.2% | -36.9% | -40.7% | 4.7% | -63.7% |
| Domestic | -5.7% | -1.8% | -4.6% | -39.3% | -22.1% | -30.9% | 3.9% | -41.2% |
| Real Sector Sales | ||||||||
| MFG/Mining | -4.2% | -6.6% | -5.5% | -49.0% | -28.6% | -23.2% | 5.1% | -49.7% |
| Consumer | -3.2% | -6.0% | 3.4% | -21.7% | -11.5% | -11.2% | -0.6% | -27.4% |
| Cons Durables | -7.9% | -2.2% | -5.3% | -47.0% | -27.2% | -22.3% | -0.6% | -41.3% |
| Cons Non-Durable | -2.5% | -6.6% | 4.9% | -16.6% | -8.7% | -9.3% | -0.5% | -24.6% |
| Capital Gds | -4.8% | -9.4% | -8.4% | -61.0% | -37.5% | -29.2% | 9.2% | -61.3% |
| Intermediate Gds | -3.5% | -4.6% | -7.5% | -47.5% | -27.5% | -24.2% | 3.9% | -48.5% |
| All MFG-Sales | -4.3% | -6.6% | -5.8% | -49.7% | -29.1% | -23.4% | 5.1% | -50.2% |
by Robert Brusca April 8, 2009
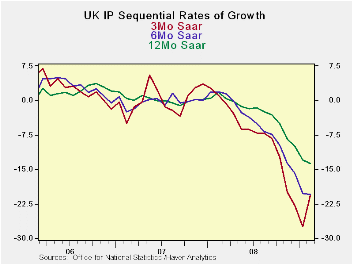
UK’s industrial output index fell again making it twelve
straight months of decline. There is a slight let up in the pace of
decline in IP as the growth rate’s declining profile at the three month
tenor shows signs of abating (see chart). Still other trends show that
strong downward momentum remains in force.
Consumer durables output accelerated its drop over
three-months compared to six months as did intermediate and capital
goods industries. Even so, each of these the three-month growth rates
for February was stronger than in January. Consumer nondurables
industrial output rose in February. Most sectors saw growth rates
worsen over three-months compared to six months. Food and drink was an
exception; motor vehicles were another exception as growth rates
hovered at a horrific -64% annual rate.
The growth rates being posted for the quarter-to-date continue
to be very weak and in line with recent trends. Q1 is cropping up to be
another bad one.
| UK IP and MFG | ||||||||||
|---|---|---|---|---|---|---|---|---|---|---|
| Saar except m/m | Mo/Mo | Feb 09 |
Jan 09 |
Feb 09 |
Jan 09 |
Feb 09 |
Jan 09 |
|||
| UK MFG | Feb 09 |
Jan 09 |
Dec 08 |
3Mo | 3Mo | 6mo | 6mo | 12mo | 12mo | Q1 Date |
| MFG | -0.9% | -3.0% | -1.9% | -20.7% | -27.4% | -20.4% | -20.2% | -13.8% | -13.0% | -24.2% |
| Consumer | ||||||||||
| C-Durables | -0.4% | -4.8% | -3.6% | -30.1% | -35.3% | -26.6% | -27.6% | -21.3% | -19.8% | -33.0% |
| C-Non-durables | -0.1% | 0.8% | -0.5% | 0.8% | -6.8% | -5.4% | -5.6% | -5.0% | -4.4% | -1.2% |
| Intermediate | -1.4% | -3.3% | -1.7% | -23.0% | -25.4% | -20.7% | -19.9% | -13.8% | -12.7% | -25.0% |
| Capital | -1.6% | -5.4% | -2.1% | -31.1% | -36.4% | -26.1% | -25.3% | -16.9% | -16.1% | -35.1% |
| Memo:Detail | 1Mo% | 1Mo% | 1Mo% | 3Mo | 3Mo | 6mo | 6mo | 12mo | 12mo | Q1 Date |
| Food Drink&tobacco | 0.2% | 1.6% | -2.1% | -1.6% | -5.9% | -3.4% | -2.4% | -3.9% | -3.8% | -0.5% |
| Textile&Leather | -0.8% | -1.5% | -2.1% | -16.6% | -6.5% | -10.8% | -11.3% | -5.4% | -4.1% | -12.3% |
| Motor Vehicles & trailer | -4.1% | -18.8% | -0.8% | -64.3% | -77.2% | -46.5% | -64.9% | -46.0% | -43.5% | -74.9% |
| Mining and Quarry | -0.9% | -2.9% | -0.3% | -15.1% | -6.8% | -8.4% | -7.8% | -7.7% | -7.8% | -13.7% |
| Electricity, gas&H2O | -2.5% | 0.1% | 0.4% | -7.9% | -3.5% | -7.6% | -5.6% | -4.9% | -2.6% | -6.4% |

Tom Moeller
AuthorMore in Author Profile »Prior to joining Haver Analytics in 2000, Mr. Moeller worked as the Economist at Chancellor Capital Management from 1985 to 1999. There, he developed comprehensive economic forecasts and interpreted economic data for equity and fixed income portfolio managers. Also at Chancellor, Mr. Moeller worked as an equity analyst and was responsible for researching and rating companies in the economically sensitive automobile and housing industries for investment in Chancellor’s equity portfolio. Prior to joining Chancellor, Mr. Moeller was an Economist at Citibank from 1979 to 1984. He also analyzed pricing behavior in the metals industry for the Council on Wage and Price Stability in Washington, D.C. In 1999, Mr. Moeller received the award for most accurate forecast from the Forecasters' Club of New York. From 1990 to 1992 he was President of the New York Association for Business Economists. Mr. Moeller earned an M.B.A. in Finance from Fordham University, where he graduated in 1987. He holds a Bachelor of Arts in Economics from George Washington University.
More Economy in Brief


