 Global| Aug 06 2009
U.S. Weekly Claims For JoblessInsurance Inch Lower While Continuing Claims Tick Higher
by:Tom Moeller
|in:Economy in Brief
Summary
Improvement in the U.S. labor market still is evident, but lately it's been a halting trend. The latest figures from the Labor Department indicate that initial claims for unemployment insurance fell last week to 550,000 and more than [...]
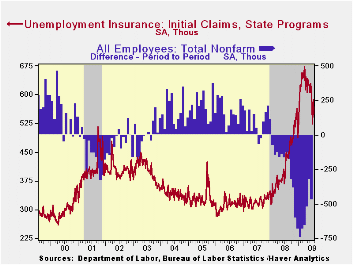
Improvement in the U.S. labor market still is evident, but lately it's been a halting trend. The latest figures from the Labor Department indicate that initial claims for unemployment insurance fell last week to 550,000 and more than reversed the prior week's unrevised increase. For all of July, claims fell 9.4% from June, but since the beginning of the month they moved sideways. The four-week moving average of claims, which smoothes out some of the volatility in the weekly numbers, slipped to 555,250 which was its lowest level since late-January. A rise in weekly claims to 580,000 had been expected.
The Bureau of Labor Statistics will release the report on July nonfarm payrolls tomorrow. During the last ten years, there has been an 86% correlation between the level of initial unemployment insurance claims and the m/m change in payroll employment.
The Labor Department indicated that the largest increases in initial claims for the week ending July 25 were in Ohio (+891, +3.6% y/y), Oklahoma (+644, +121% y/y), Mississippi (+222, -5.2% y/y), Louisiana (+154, +33.7% y/y), and Alaska (+129, +51.9% y/y), while the largest decreases were in North Carolina (-9,809, +17.7% y/y), Michigan (-9,085, +20.9% y/y), Florida (-8,714, +11.9% y/y), Georgia (-6,948, +61.5% y/y), and Alabama (-3,822, +31.8% y/y).
 A sideways movement in continuing claims for unemployment
insurance also became apparent last month. For the latest week, they
rose a modest 69,000 and that was enough to reverse the declines during
the prior two weeks. Continuing claims provide an indication of
workers' ability to find employment and the level of 6,310,000
claims is up sharply from the year-ago level. The four-week
average of continuing claims fell back to 6,378,750 and that was the
lowest since late-April. The series dates back to 1966.
A sideways movement in continuing claims for unemployment
insurance also became apparent last month. For the latest week, they
rose a modest 69,000 and that was enough to reverse the declines during
the prior two weeks. Continuing claims provide an indication of
workers' ability to find employment and the level of 6,310,000
claims is up sharply from the year-ago level. The four-week
average of continuing claims fell back to 6,378,750 and that was the
lowest since late-April. The series dates back to 1966.
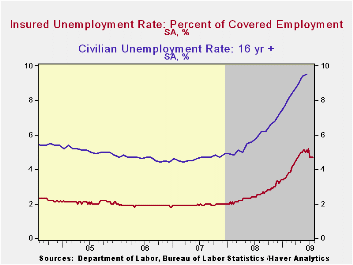
 The insured rate of unemployment remained at 4.7% which was
the lowest level since mid-April. During the last ten years, there has
been a 93% correlation between the level of the insured unemployment
rate and the overall rate of unemployment published by the Bureau of
Labor Statistics.
The insured rate of unemployment remained at 4.7% which was
the lowest level since mid-April. During the last ten years, there has
been a 93% correlation between the level of the insured unemployment
rate and the overall rate of unemployment published by the Bureau of
Labor Statistics.
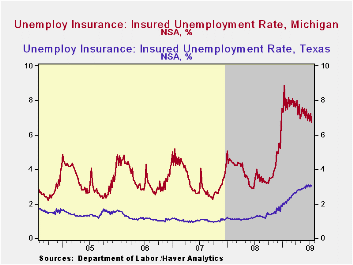
The highest insured unemployment rates in the week ending July 18 were in Puerto Rico (8.0 percent), Michigan (6.7), Oregon (6.5), Pennsylvania (6.5), Nevada (6.1), Wisconsin (5.7), Connecticut (5.5), New Jersey (5.5), California (5.4), Rhode Island (5.3), and South Carolina (5.3). The lowest rates were in South Dakota (1.4) and North Dakota (1.5), Virginia (2.5), Wyoming (3.0), Texas (3.1), Maine (3.3), Colorado (3.3), Maryland (3.7), Minnesota (3.8), Florida (4.3), Mississippi (4.3), New York (4.4) and Georgia (4.4).
The unemployment insurance claims data is available in Haver's WEEKLY database and the state data is in the REGIONW database
| Unemployment Insurance (000s) | 08/01/09 | 07/25/09 | 07/18/09 | Y/Y | 2008 | 2007 | 2006 |
|---|---|---|---|---|---|---|---|
| Initial Claims | 550 | 588 | 559 | 22.2% | 420 | 321 | 313 |
| Continuing Claims | -- | 6,310 | 6,241 | 88.7% | 3,342 | 2,552 | 2,459 |
| Insured Unemployment Rate (%) | 4.7 | 4.7 | 2.5 | 2.5 | 1.9 | 1.9 |
by Robert Brusca August 6, 2009
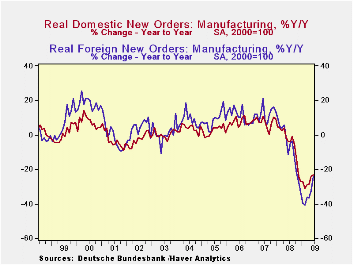
German new orders rose by 4.5% in June after rising by 4.4% in
May. Orders are up and at a 42% annual rate over three-months and STILL
they stand lower by 23.7% than they did one year ago. In the newly
completed second quarter, orders are up at a 26.8% annual rate. While
real sector sales in mining and MFG are up at a 3.4% pace in the
quarter. Germany is beginning to turn the corner, despite ongoing
weakness in retail sales.
German domestic orders barely nudged higher rising by nearly
rounding error (0.2%) in June. Foreign orders spurted by 8.3% putting
in their second strong month in a row. Exports remain the lifeblood of
the German economy. The report that Hungary’s industrial output rose
for the second month in a row is good news for Germany, suggesting that
eastern European export markets are among those that are reviving.
In June German real sector sales for consumer goods rose by
0.2% as consumer durables plunged by 3.7%. Capital goods real sales
rose by 1.2% after spurting by 9.2% in May. Intermediates goods sales
rose by 2.8%. German real sector sales were up across the abroad in the
quarter as well with the exception of consumer durables, where sales
fell in the quarter at a hefty -8.4% annual rate.
| German Orders and Sales By Sector and Origin | ||||||||
|---|---|---|---|---|---|---|---|---|
| Real and SA | % M/M | % Saar | ||||||
| Jun-09 | May-09 | Apr-09 | 3-MO | 6-Mo | 12-Mo | YrAgo | QTR-2-Date | |
| Total Orders | 4.5% | 4.4% | 0.1% | 42.6% | 19.4% | -23.7% | -8.0% | 26.8% |
| Foreign | 8.3% | 4.9% | -0.9% | 61.2% | 27.0% | -24.2% | -11.4% | 40.0% |
| Domestic | 0.2% | 4.1% | 1.1% | 23.8% | 11.3% | -23.1% | -3.6% | 13.5% |
| Real Sector Sales | ||||||||
| MFG/Mining | 1.4% | 4.6% | -2.0% | 16.6% | 8.0% | -17.4% | 0.9% | 3.4% |
| Consumer | 0.2% | -2.2% | 4.0% | 8.0% | 3.9% | -6.8% | -3.9% | 4.7% |
| Consumer Durables | -3.7% | 6.1% | -1.2% | 3.8% | 1.9% | -21.8% | -1.6% | -8.4% |
| Consumer Nondurables | 0.6% | -3.2% | 4.6% | 7.8% | 3.8% | -4.1% | -4.2% | 6.7% |
| Capital Goods | 1.2% | 9.2% | -7.3% | 10.1% | 4.9% | -22.3% | 3.9% | 1.2% |
| Intermediate Goods | 2.8% | 2.8% | 1.5% | 32.0% | 14.9% | -18.2% | 1.2% | 9.7% |
| All MFG-Sales | 1.5% | 4.4% | -2.0% | 16.6% | 8.0% | -17.6% | 0.8% | 3.3% |

Tom Moeller
AuthorMore in Author Profile »Prior to joining Haver Analytics in 2000, Mr. Moeller worked as the Economist at Chancellor Capital Management from 1985 to 1999. There, he developed comprehensive economic forecasts and interpreted economic data for equity and fixed income portfolio managers. Also at Chancellor, Mr. Moeller worked as an equity analyst and was responsible for researching and rating companies in the economically sensitive automobile and housing industries for investment in Chancellor’s equity portfolio. Prior to joining Chancellor, Mr. Moeller was an Economist at Citibank from 1979 to 1984. He also analyzed pricing behavior in the metals industry for the Council on Wage and Price Stability in Washington, D.C. In 1999, Mr. Moeller received the award for most accurate forecast from the Forecasters' Club of New York. From 1990 to 1992 he was President of the New York Association for Business Economists. Mr. Moeller earned an M.B.A. in Finance from Fordham University, where he graduated in 1987. He holds a Bachelor of Arts in Economics from George Washington University.
More Economy in Brief


