 Global| Mar 02 2006
U.S. Vehicle Sales Down in February
by:Tom Moeller
|in:Economy in Brief
Summary
US light vehicle sales in February retraced all of the January gain and fell 5.8% to 16.61M units, the lowest level since November according to the Autodata Corporation. The decline about matched Consensus expectations for a 16.5M [...]
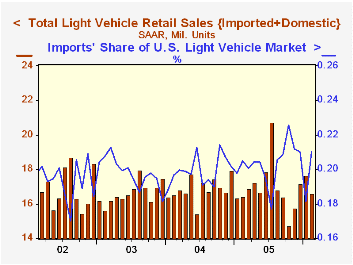
US light vehicle sales in February retraced all of the January gain and fell 5.8% to 16.61M units, the lowest level since November according to the Autodata Corporation. The decline about matched Consensus expectations for a 16.5M sales rate last month.
The sharp decline in February sales resulted from a 21.1% m/m drop (-0.5% y/y) in US made car sales. It fully retraced the prior month's rise which occurred as automakers "restocked" rental fleets.
A 1.1% (1.2% y/y) rise in sales of domestic trucks recovered a portion of the prior month's sharp drop.
Imported car sales in February recovered most of the prior month's drop and increased 13.5% (1.3% y/y) to 2.17M units while imported truck sales rose a steady 2.6% (7.8% y/y) to a record high of 1.32M units.
Imports' share of the US light vehicle market recovered to 21.0% from the depressed 18.1% during January. Imports' share during all of last year was 20.3%.
Variations in consumer sentiment across demographic groups from the Federal Reserve Bank of Chicago can be found here.
| Light Vehicle Sales (SAAR, Mil. Units) | Feb | Jan | Y/Y | 2005 | 2004 | 2003 |
|---|---|---|---|---|---|---|
| Total | 16.61 | 17.64 | 1.2% | 16.92 | 16.87 | 16.63 |
| Autos | 7.42 | 8.56 | 0.1% | 7.65 | 7.49 | 7.62 |
| Trucks | 9.20 | 9.08 | 2.1% | 9.27 | 9.37 | 9.01 |
by Tom Moeller March 2, 2006
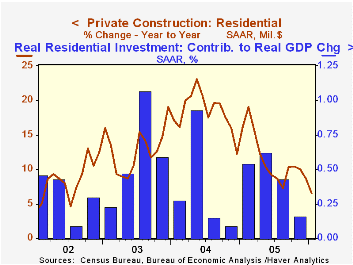
Warm temperatures in January did little for the value of construction put in place which increased just 0.2%. Consensus expectations had been for a 1.1% gain but the firm 1.0% advance in December was unrevised.
Residential building rose only 0.1 following a downwardly revised 0.9% December increase. New single family building inched up just 0.1% (13.2% y/y) while the value of improvements rose 0.2% (-10.6% y/y). The value of new multi-family residential construction fell 0.5% (+12.4% y/y).
Nonresidential building added 0.5% to a downwardly revised 1.1% December increase. Office construction slipped 0.2% (+8.9% y/y) and commercial building rose 0.4% (+9.5% y/y). These y/y gains pale when compared to multi-retail commercial which rose 7.9% in January (40.0% y/y).
Public construction spending rose 0.2% following an upwardly revised 1.3% December increase. Construction activity on highways & streets, nearly one third of the value of public construction spending, recovered the prior month's decline and rose 0.9% (12.7% y/y).
These more detailed categories represent the Census Bureau’s reclassification of construction activity into end-use groups. Finer detail is available for many of the categories; for instance, commercial construction is shown for Automotive sales and parking facilities, drugstores, building supply stores, and both commercial warehouses and mini-storage facilities. Note that start dates vary for some seasonally adjusted line items in 2000 and 2002 and that constant-dollar data are no longer computed.
| Construction Put-in-place | Jan | Dec | Y/Y | 2005 | 2004 | 2003 |
|---|---|---|---|---|---|---|
| Total | 0.2% | 1.0% | 7.4% | 9.1% | 10.9% | 5.4% |
| Private | 0.2% | 0.9% | 6.3% | 9.6% | 13.6% | 6.3% |
| Residential | 0.1% | 0.9% | 6.5% | 11.4% | 18.2% | 12.9% |
| Nonresidential | 0.5% | 1.1% | 5.6% | 5.2% | 3.9% | -5.4% |
| Public | 0.2% | 1.3% | 11.3% | 7.6% | 2.5% | 2.7% |
by Tom Moeller March 2, 2006
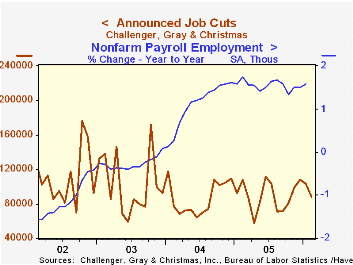
Challenger, Grey & Christmas reported that job cut announcements during February fell 15.5% (-19.3% y/y) to 87,437, the lowest level since October.
Layoffs in the auto industry fell sharply from the heated January pace but still were more than double the prior February's level. Announced job cuts in government rose 11.6% to a level more than double the prior February while layoffs in the financial industry surged m/m to a level more than double the prior year.
During the last ten years there has been an 84% (inverse) correlation between the three month moving average of announced job cuts and the three month change payroll employment.
Job cut announcements differ from layoffs. Many are achieved through attrition, early retirement or just never occur.
Challenger also reported the third consecutive m/m drop in announced hiring plans (-69.2% y/y).
| Challenger, Gray & Christmas | Feb | Jan | Y/Y | 2005 | 2004 | 2003 |
|---|---|---|---|---|---|---|
| Announced Job Cuts | 87,437 | 103,466 | -19.3% | 1,072,054 | 1,039,935 | 1,236,426 |
by Tom Moeller March 2, 2006
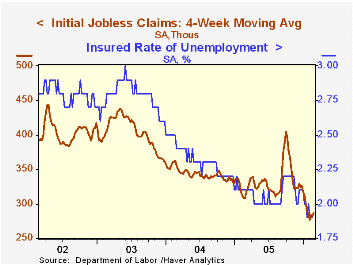
Initial unemployment insurance claims last week reversed most of the prior week's revised decline and rose 15,000 to 294,000. Consensus expectations had been for 285,000 claims.
During the last ten years there has been a (negative) 75% correlation between the level of initial jobless insurance claims and the m/m change in payroll employment.
The four-week moving average of initial claims rose to 287,250 (-6.5% y/y).
Continuing unemployment insurance claims fell 2,000 following the prior week's revised 16,000 decline which compared to a rise estimated initially.
The insured rate of unemployment was stable at 1.9% for the third week.
| Unemployment Insurance (000s) | 02/25/06 | 02/18/06 | Y/Y | 2005 | 2004 | 2003 |
|---|---|---|---|---|---|---|
| Initial Claims | 294 | 279 | -7.0% | 332 | 343 | 402 |
| Continuing Claims | -- | 2,486 | -6.8% | 2,663 | 2,924 | 3,532 |
by Carol Stone March 2, 2006
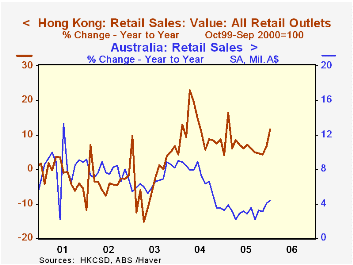
Four widely diverse areas reported retail trade today for January. Generally, these reports indicated some strength. In Hong Kong, for example, sales were up 11.6% over a year ago, extending a firmer performance into a second month. In a larger area, Germany's sales rebounded to a 2.2% year-on-year gain after being down in December. Australia and Estonia also had favorable sales increases in January.
The Hong Kong retail sales firmed noticeably for consumer electronics, and clothing had a modest increase, apparently picking up after a lull in late summer and autumn. Also in that region of the world, sales in Australia gained 4.2% from January 2005, with the food and hospitality sectors leading. Department stores and recreation good were both down from a year ago.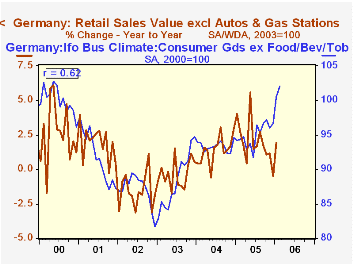
For Germany, only total sales are available in their initial release. However, notably, the improvement here corresponds to the improved sentiment of retail trade business executives reported in the Ifo survey. In detail Ifo data released Tuesday, the Business Climate Index for that sector was 96.0 in January, the third highest since 2001. Then for February, the index climbed more than 4 points to 100.7, its first reading above 100 since the base year of 2000. The correlation between year-to-year percent changes in this index and in actual retail sales is 0.44. Correlations of other Ifo indexes are even better; for instance, the total index is 0.53 and the index for consumer goods less food is 0.62. Thus, business executives of related production industries are at least as concerned about the performance in final sales as managers of the stores themselves.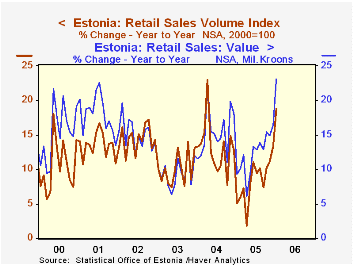
Finally, retail sales gains were good in Estonia. The year-on-year pace in January was 23%, although this magnitude partly reflects a base effect in which January 2005 was quite weak. So, when we look at the seasonally adjusted data calculated by Haver Analytics, we see that the latest figure actually shows a small decrease from December's amount. Despite this modest setback, volume growth in Estonia has actually been quite strong, up 18.8% from a year ago and off just 0.4% from December. The last three months of 2005 averaged 2.5% month-to-month gains in the volume index. Thus, Estonian consumer demand appears quite buoyant.
| Retail Trade, Yr/Yr % Changes | Jan 2006 | Dec 2005 | Nov 2005 | 2005 | 2004 | 2003 |
|---|---|---|---|---|---|---|
| Hong Kong | 11.6 | 6.8 | 4.2 | 6.8 | 10.8 | -2.3 |
| Australia | 4.2 | 3.9 | 3.8 | 2.8 | 7.2 | 6.8 |
| Germany | 2.2 | -0.5 | 1.1 | 1.5 | 2.0 | -0.5 |
| Estonia | 23.0 | 16.4 | 14.9 | 12.4 | 15.5 | 9.5 |

Tom Moeller
AuthorMore in Author Profile »Prior to joining Haver Analytics in 2000, Mr. Moeller worked as the Economist at Chancellor Capital Management from 1985 to 1999. There, he developed comprehensive economic forecasts and interpreted economic data for equity and fixed income portfolio managers. Also at Chancellor, Mr. Moeller worked as an equity analyst and was responsible for researching and rating companies in the economically sensitive automobile and housing industries for investment in Chancellor’s equity portfolio. Prior to joining Chancellor, Mr. Moeller was an Economist at Citibank from 1979 to 1984. He also analyzed pricing behavior in the metals industry for the Council on Wage and Price Stability in Washington, D.C. In 1999, Mr. Moeller received the award for most accurate forecast from the Forecasters' Club of New York. From 1990 to 1992 he was President of the New York Association for Business Economists. Mr. Moeller earned an M.B.A. in Finance from Fordham University, where he graduated in 1987. He holds a Bachelor of Arts in Economics from George Washington University.
More Economy in Brief


