 Global| Mar 11 2010
U.S. Trade Deficit UnexpectedlyMoves Lower
by:Tom Moeller
|in:Economy in Brief
Summary
Though the recession has ended, Americans' appetite for imported products remained under wraps last month. As a result, the U.S. foreign trade deficit improved to $37.3B from a little-revised $39.9B during December. The latest figure [...]
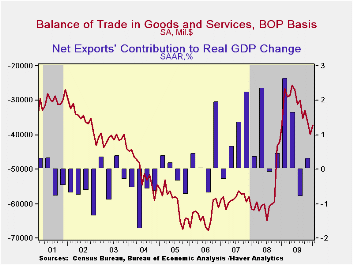
Though the recession has ended, Americans' appetite for imported products remained under wraps last month. As a result, the U.S. foreign trade deficit improved to $37.3B from a little-revised $39.9B during December. The latest figure was lower than Consensus expectations for a deficit of $41.0B.
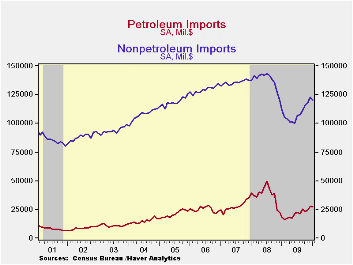
Perhaps showing the effects of the lower dollar imports fell 1.7% and reversed much of their December gain. Nevertheless, though monthly imports fell, the y/y growth accelerated to 11.9% with higher oil prices and the budding economic recovery. For the month, imports of petroleum products fell 3.1% but that factored little into an annual gain of roughly 50%. That reflected the near-doubling of energy prices which included crude oil rising to $73.89 per barrel. The price shock did not come, however, without a demand reaction. The quantity of petroleum imports fell 19.9% y/y following declines during the prior three years.
Outside of oil, imports did tick 2.0% lower during January as volumes slipped. However, versus last year non-oil imports rose 8.0% with the economic recovery following a 21.0%, recession-related decline for all of last year. In constant dollars, January real nonoil imports rose 7.0% as part of a nearly one-half y/y recovery in automotive vehicles & parts imports. Real nonauto consumer goods imports slipped for the second month but y/y they have grown 2.1% following a 10.8% decline during 2009. Capital goods imports also have recovered. Year-to-year growth of 7.2% spells recovery after a 18.0% drop last year. That came despite a 2.9% m/m January decline. Finally, services imports rose another 0.4% (4.1% y/y) after a sharp 1.4% December gain. U.S. travels abroad slipped 0.8% (-0.9% y/y) after a sharp December increase. Passenger fares slipped 0.4% (-6.7% y/y) but "other" transportation charges jumped 1.7% (4.9% y/y).
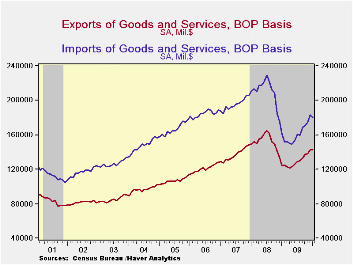
Continuing to reflect the competitive value of the dollar, nominal exports slipped just 0.3% m/m (+15.1% y/y) after the 3.4% jump during December. Though real merchandise exports fell 1.6% from December, the y/y gain of 14.2% is the strongest since early-2008. Real capital goods exports fell 2.6% (+4.3% y/y) and auto exports fell 5.7% (+61.8% y/y). Offsetting these declines was a 1.3% increase (17.7% y/y) in real exports of non-auto consumer goods. Exports of services ticked up 0.4% (6.4% y/y) for the third month of slight increase.
By country, the trade deficit with mainland China held roughly steady at $18.3B. That's still near its least since April and the deficit is down from its peak of $27.9B in October of 2008. Exports to China rose by nearly two-thirds y/y while imports rose just 1.8%. With Japan, the trade deficit improved to $3.3B from $4.3B one year earlier as exports rose 21.2% and imports fell 1.3%. With the European Union, the trade deficit narrowed to $2.8B, near its least since 1999 as exports rose 5.7% y/y and imports increased just 1.5%.
The international trade data can be found in Haver's USECON database. Detailed figures are available in the USINT database.
Okun's Law: Output & Unemployment from the Federal Reserve Bank of St. Louis is available here here.
| Foreign Trade | January | December | November | Y/Y | 2009 | 2008 | 2007 |
|---|---|---|---|---|---|---|---|
| U.S. Trade Deficit | $37.3B | $39.9B | $36.1B | $36.9B (1/09) | $378.6B | $695.9B | $701.4B |
| Exports - Goods & Services | -0.3% | 3.4% | 0.9% | 15.1% | -14.9% | 11.2% | 13.2% |
| Imports - Goods & Services | -1.7 | 4.9 | 2.6 | 11.9 | -23.4 | 7.6 | 6.0 |
| Petroleum | -3.1 | 15.1 | 7.4 | 48.9 | -44.1 | 37.0 | 9.4 |
| Nonpetroleum Goods | -2.0 | 3.8 | 2.3 | 8.0 | -21.0 | 1.5 | 4.8 |
by Robert Brusca March 11, 2010
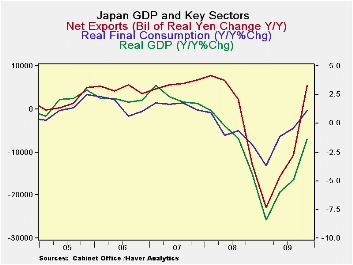
The back off in Japan’s core machinery orders this week began to deflate expectations for a capital formation jolt to spur growth. Still, gross capital formation did fall much more slowly in Q4 compared to Q3 as plant and equipment spending swung to post positive results for the quarter. Residential construction continued to fall but the drop is only at about half the pace of the decline of earlier quarters. Domestic demand is up by a mere 2.1% annualized in Q4. Public spending rose at a 2.5% annual rate. But exports are flying, leading growth with a 21% growth rate. That is slower than previous quarters but still, obviously, a very strong rate of growth. Imports, once up a 23% pace in Q3 edged higher at just a 5.1% annual rate in Q4.
Yr-over-year trends show a more pronounced export slowing and more stability in imports. Domestic demand is shrinking year-over-year. Japan’s growth posted a drop of only 1.4% Yr/Yr in Q4 compared to a Yr/Yr drop of 4.9% in Q3.
On balance the Japanese economy is doing better but its improvement is mostly in the hands of the export sector. Fortunately for Japan its two largest export markets, China and the US, are posting improved growth; China’s growth has been very strong. Japan’s strength still derives mostly from its export sector. The domestic economy is marking some growth but with no vigor. Since the main impetus to growth is exports there is some hope that that will translate into expansion and to more capital spending in export and export-related industries. This would help to boost Japan’s output internally even though the real cause of the investment would be external demand. The drop off in core machinery orders this past week began to dash hope that such an effect was gathering steam in the pipeline. Japan’s recovery is still very dependent on what goes on outside its borders. The domestic support for its expansion is minimal. More disturbing is the conclusion that there is little evidence that its export strength is rekindling domestic sources of growth.
| Japan's GDP | ||||||||||
|---|---|---|---|---|---|---|---|---|---|---|
| Consumption | Capital Formation | Trade | Domestic Demand |
|||||||
| GDP | Private | Public | Gross Fix Cap |
Plnt& Equip |
Housing | X-M: lbns E |
Exports | Imports | ||
| Change Q/Q at annual rates of change; X-M is Q/Q change in Blns of real yen | ||||||||||
| Q4-09 | 3.8% | 2.8% | 2.5% | -0.4% | 3.8% | -12.5% | 2.9 | 21.7% | 5.1% | 1.5% |
| Q3-09 | -0.6% | 2.4% | 0.3% | -11.7% | -9.8% | -27.7% | 2.8 | 37.8% | 23.3% | -1.9% |
| Q2-09 | 6.0% | 4.6% | 1.1% | -11.0% | -15.6% | -32.6% | 7.5 | 42.2% | -14.7% | -1.1% |
| Q1-09 | -13.7% | -5.2% | 3.2% | -22.6% | -30.6% | -23.7% | -7.7 | -66.3% | -53.9% | -11.3% |
| Change Yr/Yr; X-M is Yr/Yr change in Gap in Blns of real yen | ||||||||||
| Q4-09 | -1.4% | 1.1% | 1.8% | -11.8% | -13.9% | -24.5% | 5.5 | -5.3% | -15.5% | -3.3% |
| Q3-09 | -4.9% | -0.4% | 2.3% | -15.8% | -20.9% | -20.0% | -10.7 | -22.9% | -16.5% | -3.7% |
| Q2-09 | -6.0% | -1.1% | 2.0% | -15.0% | -22.0% | -9.8% | -15.8 | -29.4% | -18.7% | -3.9% |
| Q1-09 | -8.4% | -3.7% | 0.5% | -13.9% | -19.6% | -0.3% | -22.9 | -36.3% | -17.7% | -4.9% |
| 5-Yrs | 0.1% | 0.8% | 1.1% | -3.6% | -2.3% | -8.5% | na | 1.1% | -1.4% | -0.3% |
by Tom Moeller March 11, 2010
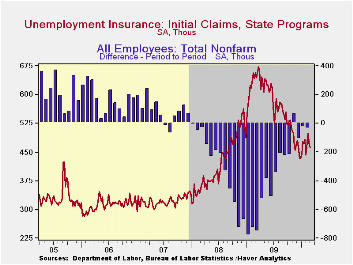
Improvement in the labor market is ongoing, but slowing. Initial claims for jobless insurance slipped 6,000 last week to 462,000 from a little revised 468,000 during the prior week. Versus last month claims fell slightly and from December they're roughly flat. This flattening compares to the earlier sharp decline from the recession peak of 674,000 hit twelve months ago. Moreover, claims remained near the lowest level since January 2009. The weekly decline about matched the Consensus expectation. The four-week moving average of initial claims inched up to 475,500.
Continuing claims for unemployment insurance during the latest week remained near the cycle-low and were down by one-third since late-June. The overall decline is a function of the improved job market but also reflects the exhaustion of 26 weeks of unemployment benefits. Continuing claims provide an indication of workers' ability to find employment. The four-week average of continuing claims held steady at the cycle low of 4.581 mil. This series dates back to 1966.
Extended benefits for unemployment insurance dropped sharply to another cycle low of 163,291. They were down by two-thirds from a peak of 597,688 reached in November.Each State administers a separate unemployment insurance program within guidelines established by Federal law. Benefit amounts and the length of time benefits are received and determined by State law. For example, in both Michigan and New York an additional 73 weeks of benefits are available.
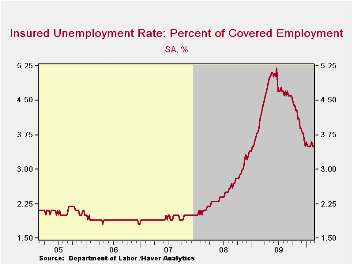
The insured rate of unemployment held steady at 3.5% during the prior week. The rate reached a high of 5.2% during late-June. During the last ten years, there has been a 93% correlation between the level of the insured unemployment rate and the overall rate of unemployment published by the Bureau of Labor Statistics.
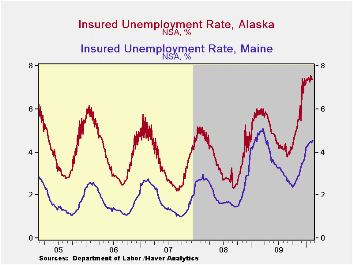
The highest insured unemployment rates in the week ending February 14 were in Alaska (7.4% percent), Oregon (6.4), Idaho (6.3), Montana (6.2), Wisconsin (6.2), Pennsylvania (6.2), Michigan (5.7), Nevada (5.6) and North Carolina (5.2). The lowest insured unemployment rates were in Virginia (2.3), Texas (2.4), Florida (3.3), Georgia (3.3), Mississippi (3.6), Wyoming (3.7), Maryland (3.7), Ohio (3.8), Indiana (3.9), New York (4.3) and Maine (4.6). These data are not seasonally adjusted but the overall insured unemployment rate is.
| Unemployment Insurance (000s) | 3/6/10 | 2/27/10 | 2/20/10 | Y/Y | 2009 | 2008 | 2007 |
|---|---|---|---|---|---|---|---|
| Initial Claims | 462 | 468 | 498 | -29.7% | 573 | 419 | 321 |
| Continuing Claims | -- | 4,558 | 4,521 | -13.2% | 5,835 | 3,345 | 2,552 |
| Insured Unemployment Rate (%) | -- | 3.5 | 3.5 | 4.3 (3/2009) | 4.4 | 2.5 | 1.9 |
by Carol StoneMarch 11, 2010
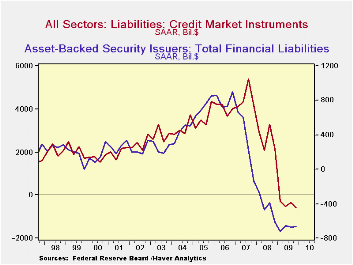
U.S. nonfinancial corporations paid down debt in Q4 2009, according to the Federal Reserve's Flow-of-Funds data reported today, March 11. The contraction was minimal, $8.2 billion at a seasonally adjusted annual rate, but it is the first quarterly reduction since Q3 2002 and it gives a dramatic contrast to the $999 billion borrowing surge in Q3 2007, just at the peak of the late economic expansion.
Total credit market debt contracted as well in Q4, with net
paydowns of $577 billion, SAAR, the fourth consecutive negative
quarter. The major contributing sector was financial institutions,
which pulled down their liabilities at almost a $1.3 trillion annual
rate, also a fourth consecutive reduction. The continuing shrinkage of
the market for asset-backed securities accounted for the biggest part,
as these fell at a $660 billion pace, a ninth consecutive down quarter.
Banks, saving institutions and the GSEs' themselves all shrank their
liabilities -- although GSE mortgage-backed pools were still expanding
-- and finance companies participated in the decline. Among
nonfinancial borrowers, households and noncorporate businesses reduced
their debt, households for the seventh quarter in a row and small
businesses for a fourth quarter.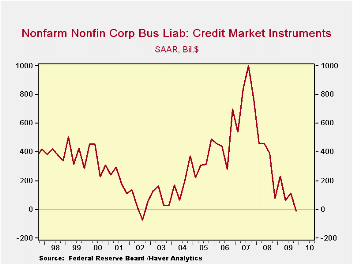
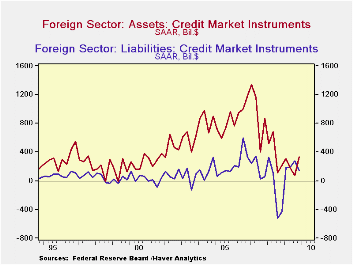
It almost goes without saying that the Federal Government was an exception to this pattern of debt reduction, although their $956 billion increase was the smallest in six quarters. Such a "pause" is likely to be short-lived. State and local governments, which have run aggregate deficits according to national income accounting since Q4 2007, have also been net borrowers. Foreign borrowers also absorbed some capital in Q4, although modestly less than in Q3 and also modest less than the inflow of funds they provided to domestic borrowers. All told, their participation in U.S. credit markets was quite even-handed in 2009, much more so than in the previous six or seven years.
| Flow of Funds (Y/Y % Chg.) | % of Total Outstanding | 4Q '09 | 3Q '09 | 2Q '09 | End of Year | ||
|---|---|---|---|---|---|---|---|
| 2008 | 2007 | 2006 | |||||
| Total Credit Market Debt Outstanding | 100.0% | -0.2 | 0.9 | 2.8 | 5.0 | 10.4 | 9.8 |
| Federal Government | 14.9% | 22.7 | 30.1 | 35.9 | 24.2 | 4.9 | 3.9 |
| Households | 25.8% | -1.7 | -1.8 | -1.3 | 0.2 | 6.7 | 10.0 |
| Nonfinancial Corporate Business | 13.8% | 1.5 | 1.8 | 2.8 | 5.1 | 13.2 | 8.5 |
| Nonfarm, Noncorporate Business | 6.8% | -7.9 | -5.4 | -1.9 | 5.5 | 14.2 | 14.7 |
| Financial Sectors | 29.9% | -8.4 | -5.6 | -1.3 | 5.4 | 13.5 | 9.9 |
| Trillions of $ | |||||||
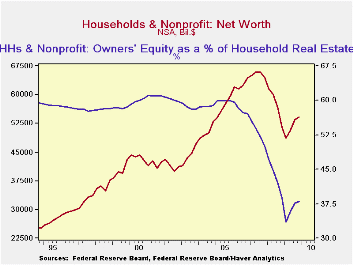
| Net Worth: Households & Nonprofit Organizations | -- | $54.176 | $53.494 | $50.711 | $51,403 | $64.484 | $64.464 |
| Tangible Assets: Households | -- | $23.063 | $23.082 | $22.790 | $23.891 | $28.036 | $29.735 |
| Financial Assets: Households | -- | $45.115 | $44.438 | $41.963 | $41.707 | $50.7698 | $48.134 |
| Total Liabilities: Households | -- | $14.001 | $14.027 | $14.042 | $14.195 | $14.312 | $13.405 |

Tom Moeller
AuthorMore in Author Profile »Prior to joining Haver Analytics in 2000, Mr. Moeller worked as the Economist at Chancellor Capital Management from 1985 to 1999. There, he developed comprehensive economic forecasts and interpreted economic data for equity and fixed income portfolio managers. Also at Chancellor, Mr. Moeller worked as an equity analyst and was responsible for researching and rating companies in the economically sensitive automobile and housing industries for investment in Chancellor’s equity portfolio. Prior to joining Chancellor, Mr. Moeller was an Economist at Citibank from 1979 to 1984. He also analyzed pricing behavior in the metals industry for the Council on Wage and Price Stability in Washington, D.C. In 1999, Mr. Moeller received the award for most accurate forecast from the Forecasters' Club of New York. From 1990 to 1992 he was President of the New York Association for Business Economists. Mr. Moeller earned an M.B.A. in Finance from Fordham University, where he graduated in 1987. He holds a Bachelor of Arts in Economics from George Washington University.
More Economy in Brief


