 Global| Jul 13 2005
U.S. Trade Deficit Smaller
by:Tom Moeller
|in:Economy in Brief
Summary
The U.S. foreign trade deficit improved more than expected in May to $55.3B versus April's downwardly revised deficit of $56.9. Consensus expectations had been for a deficit of $57.0B. Total exports ticked up 0.1% after the 3.3% spike [...]
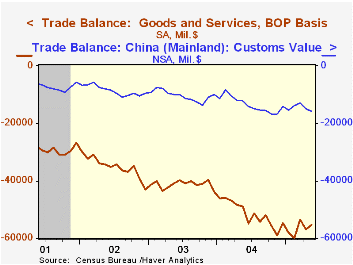
The U.S. foreign trade deficit improved more than expected in May to $55.3B versus April's downwardly revised deficit of $56.9. Consensus expectations had been for a deficit of $57.0B.
Total exports ticked up 0.1% after the 3.3% spike in April. Goods exports slipped 0.1% (+9.3% y/y) as capital goods fell 3.0% (+4.3% y/y) due to a 28.4% (+13.4% y/y) drop in civilian aircraft. Exports of advanced technology products fell for the second month and the 8.0% decline (NSA, +0.8% y/y) was nearly double the drop in April. Exports of nonauto consumer goods rose 4.7% (13.9% y/y) and exports of foods, feeds & beverages jumped 11.1% (15.9% y/y).
Services exports rose 0.6% (14.8% y/y) as passenger fares rose 2.9% (17.3% y/y) but private travel fell 0.3% (+15.8% y/y).
Imports of goods & services fell 0.9% as imports of petroleum products fell 6.8% (+35.5% y/y). The average price of crude oil fell 3.8% to $43.08 per bbl. (+30.0% y/y). Since May the price of oil has more than recouped that decline and risen to roughly $50 per bbl. Imports of non-petroleum goods slipped 0.3% (+9.1% y/y) as capital goods imports fell 1.8% (+11.3% y/y).
The US trade deficit with China deepened to $15.8B ($161.9B in 2004) as imports were strong for the second consecutive month and jumped 5.1% (26.4% y/y). The US trade deficit with Japan again improved slightly to $6.6B ($75.6B in 2004) but the monthly trade deficit with the Asian NICs deepened to $1.2B ($21.9B in 2004). The US trade deficit with the European Union deepened to $10.5B ($109.3B in 2004).
U.S. Economic Growth, Relatively Speaking from the Federal Reserve Bank of St. Louis can be found here.
| Foreign Trade | May | April | Y/Y | 2004 | 2003 | 2002 |
|---|---|---|---|---|---|---|
| Trade Deficit | $55.3B | $56.9B | $48.7B (5/04) | $617.6B | $494.8B | $421.2B |
| Exports - Goods & Services | 0.1% | 3.3% | 10.9% | 12.6% | 4.6% | -3.0% |
| Imports - Goods & Services | -0.9% | 4.3% | 11.8% | 16.6% | 8.5% | 2.1% |
by Tom Moeller July 13, 2005
Import prices in June recovered the prior month's revised decline with a 1.0% increase and about matched Consensus expectations.
Petroleum prices more than recovered May's decline with a 7.6% jump. In early July, Brent crude moved higher to $57.69/bbl. from an average $55.37 in June.
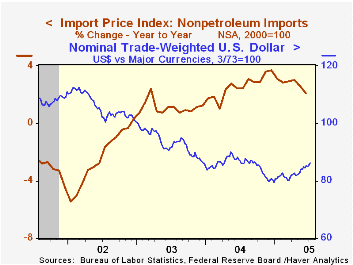
Import prices other than petroleum posted the second consecutive monthly decline and fell 0.4% last month. The decline primarily reflected a 1.7% drop in prices for foods, feeds & beverages.
Prices for nonauto consumer goods fell 0.1% (+1.4% y/y) and capital goods prices were unchanged (0.0% y/y). Excluding computers capital goods prices also were unchanged (2.9% y/y).
During the last ten years there has been a 66% (negative) correlation between the nominal trade-weighted exchange value of the US dollar vs. major currencies and the y/y change in non oil import prices. The correlation is a lower 47% against a broader basket of currencies and a lower 57% against the real value of the dollar.
Export prices were unchanged.
| Import/Export Prices (NSA) | June | May | Y/Y | 2004 | 2003 | 2002 |
|---|---|---|---|---|---|---|
| Import - All Commodities | 1.0% | -1.0% | 7.0% | 5.6% | 2.9% | -2.5% |
| Petroleum | 7.6% | -4.8% | 37.6% | 30.5% | 21.0% | 3.0% |
| Non-petroleum | -0.4% | -0.2% | 2.1% | 2.6% | 1.1% | -2.4% |
| Export - All Commodities | 0.0% | -0.2% | 3.2% | 3.9% | 1.6% | -1.0% |
by Tom Moeller July 13, 2005
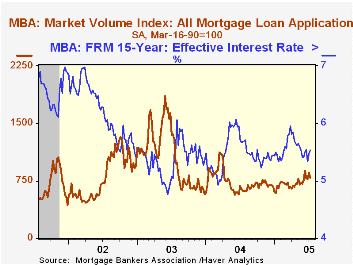
Total mortgage applications gave back last week most of the prior week's surge and fell 7.2, according to the Mortgage Bankers Association. Applications nevertheless remained 2.6% above the June average which rose 9.9% versus May.
Purchase applications fell 6.1% w/w after the 9.1% jump the prior period and in July are 2.7% above June which rose 1.3% from May. During the last ten years there has been a 50% correlation between the y/y change in purchase applications and the change in new plus existing single family home sales.
Applications to refinance fell for the third week in the last four but in July are 2.4% ahead of June.
The effective interest rate on a conventional 30-year mortgage increased for the second week and rose to 5.87%. The effective rate on a 15-year mortgage also rose to 5.53% after falling from the peak of 5.96%.
The Mortgage Bankers Association surveys between 20 to 35 of the top lenders in the U.S. housing industry to derive its refinance, purchase and market indexes. The weekly survey accounts for more than 40% of all applications processed each week by mortgage lenders. Visit the Mortgage Bankers Association site here.
| MBA Mortgage Applications (3/16/90=100) | 07/08/05 | 07/01/05 | Y/Y | 2004 | 2003 | 2002 |
|---|---|---|---|---|---|---|
| Total Market Index | 791.9 | 853.4 | 23.0% | 735.1 | 1,067.9 | 799.7 |
| Purchase | 489.0 | 520.8 | 4.3% | 454.5 | 395.1 | 354.7 |
| Refinancing | 2,554.3 | 2,788.2 | 53.7% | 2,366.8 | 4,981.8 | 3,388.0 |
by Carol Stone July 13, 2005
In addition to the usual national trade data that Haver carries in the USECON and USINT databases, regional databases give information on foreign trade shipments into and out of various locations around the country. Some time ago, we described EXPORTSR, an annual database, and its associated monthly counterparts. These contain exports from individual states to specific countries by broad product category. We also have the PORTS database, showing the value and weight of imports and exports through various ports, by both sea and air transportation. This database covers 46 customs districts encompassing 443 ports. All of these huge quantities of data are produced by the Census Bureau and are released on the same day as the aggregate trade data.
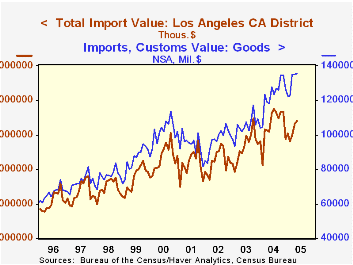
The table below shows imports arriving at a sample of Customs Districts. Los Angeles is the largest and includes the ports of Los Angeles and Long Beach as well as Los Angeles International Airport (LAX), among others. Its merchandise receipts in May were $21.6 billion, up 6.1% from a year ago. [Exports outbound from there were $6.7 billion, up 6.7%.]
In the New York area, imports were almost exactly $16.0 billion in May, up 16.5% from May 2004. An interesting aspect of New York trade is the huge value of imports that come by air through JFK Airport, as seen below, $6.5 billion in May and an average of $6.1 billion for all of last year.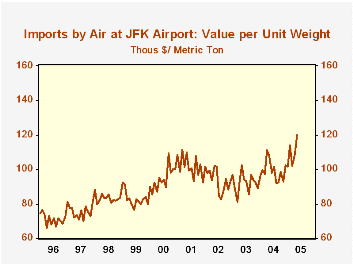
At the same time, the volume of these flows in metric tons is vastly different. A rule of thumb in shipping is that items with high value per unit weight are good for air freight, while the opposite is true for sea-going trade. A quick comparison illustrates this easily. Goods coming into JFK in May weighed 53,740 metric tons, yielding a unit value of $120,077. Goods coming by ship into Port Newark were worth $7.399 billion, but they weighed 4.5 million metric tons (MT), a value per MT of just $1,638.
| Customs District: Customs Value, NSA, Million $ | May 2005 | Apr 2005 | May 2004 | Monthly Averages|||
|---|---|---|---|---|---|---|
| 2004 | 2003 | 2002 | ||||
| Total Imports | 135,542 | 135,257 | 118,271 | 122,475 | 104,760 | 96,780 |
| New York total | 16,000 | 15,331 | 13,736 | 14,800 | 13,070 | 12,161 |
| Air at JFK | 6,453 | 6,220 | 5,563 | 6,050 | 5,442 | 5,723 |
| Los Angeles | 21,627 | 21,261 | 20,389 | 21,005 | 18,609 | 16,984 |
| Seattle | 6,091 | 6,167 | 4,825 | 5,408 | 4,558 | 4,378 |
| Chicago Total | 4,570 | 4,665 | 3,821 | 4,473 | 3,750 | 3,245 |
| Chicago Air | 3,423 | 3,602 | 2,798 | 3,349 | 2,813 | 2,433 |
| New Orleans | 7,157 | 7,864 | 5,242 | 5,729 | 4,384 | 3,874 |

Tom Moeller
AuthorMore in Author Profile »Prior to joining Haver Analytics in 2000, Mr. Moeller worked as the Economist at Chancellor Capital Management from 1985 to 1999. There, he developed comprehensive economic forecasts and interpreted economic data for equity and fixed income portfolio managers. Also at Chancellor, Mr. Moeller worked as an equity analyst and was responsible for researching and rating companies in the economically sensitive automobile and housing industries for investment in Chancellor’s equity portfolio. Prior to joining Chancellor, Mr. Moeller was an Economist at Citibank from 1979 to 1984. He also analyzed pricing behavior in the metals industry for the Council on Wage and Price Stability in Washington, D.C. In 1999, Mr. Moeller received the award for most accurate forecast from the Forecasters' Club of New York. From 1990 to 1992 he was President of the New York Association for Business Economists. Mr. Moeller earned an M.B.A. in Finance from Fordham University, where he graduated in 1987. He holds a Bachelor of Arts in Economics from George Washington University.
More Economy in Brief


