 Global| Mar 11 2005
U.S. Trade Deficit Deepened in January
by:Tom Moeller
|in:Economy in Brief
Summary
The U.S. foreign trade deficit in January reversed most of the prior month's improvement and deepened to $58.3B. The December deficit was revised shallower. Consensus expectations had been for a January deficit of $56.5B. Total [...]
The U.S. foreign trade deficit in January reversed most of the prior month's improvement and deepened to $58.3B. The December deficit was revised shallower. Consensus expectations had been for a January deficit of $56.5B.
Total exports rose 0.4% following an unrevised 3.2% gain in December. Goods exports rose 0.2% (15.3% y/y). Month to month gains were limited to a 3.5% increase in automotive and a 0.2% up tick in industrial supplies exports. Capital goods exports declined 0.7% (10.0% y/y) and nonauto consumer goods exports fell 2.0% (19.8% y/y).
Services exports rose 1.0% (9.7% y/y) on the strength of higher passenger fares (+22.0% y/y) and increased spending on travel (+14.6% y/y).
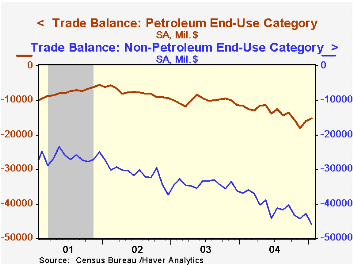
Total imports jumped 1.9% following a downwardly revised 0.4% decline in December. Petroleum imports fell for the second month, down 6.3% (+32.5% y/y) as the average price of crude oil fell to $35.35 per bbl. but imports of non-petroleum goods jumped 2.6% (+18.2% y/y). Capital goods imports rose 1.7% (14.7% y/y) and nonauto consumer goods imports surged 6.0% (17.2% y/y).
The US trade deficit with China deepened m/m in January to $15.3B ($162.0B in 2004) but the US trade deficit with Japan improved to $6.2B ($75.2B in 2004). The trade deficit with the Asian NICs more than doubled m/m to $2.3B ($21.9B in 2004). The US trade deficit with the European Union narrowed to $8.1B ($110.0B in 2004) and with OPEC the US trade deficit deepened m/m to $6.1B ($71.9B in 2004).Remarks by Federal Reserve Board Governor Ben S. Bernanke titled The Global Saving Glut and the U.S. Current Account Deficit can be found here.
| Foreign Trade | Jan | Dec | Y/Y | 2004 | 2003 | 2002 |
|---|---|---|---|---|---|---|
| Trade Deficit | $58.3B | $55.7B | $45.8B (1/04) | $617.1B | $496.5B | $421.7B |
| Exports - Goods & Services | 0.4% | 3.2% | 13.6% | 12.4% | 4.6% | -3.1% |
| Imports - Goods & Services | 1.9% | -0.4% | 18.2% | 16.3% | 8.5% | 2.1% |
by Carol Stone March 11, 2005
The Census Bureau reports trade data in a number of ways, and Haver banks a good deal of them in regional databases. The REGIONAL database includes a monthly summary of exports of goods by state, which is released at the same time as the other detail on the monthly trade reports. Just a few hours later, data on shipments through specific ports are released for both exports and imports; Haver includes these in the PORTS database. Once a quarter an incredible amount of detail is published for exports by states by NAICS Code by country. So you can see there, for instance, the value of machinery shipped from Tennessee to Azerbaijan. These data are divided among nine databases, one for each Census Region.
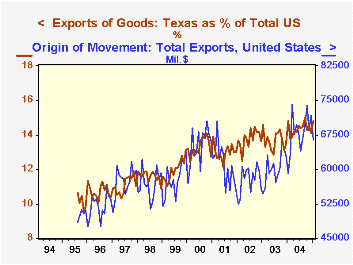
Today's January trade report, as noted by Tom Moeller, saw a widening of the trade deficit for January. But even so, US exports appear to be quite strong. Shipments of goods abroad totaled $66.38 billion, not seasonally adjusted, up 12.2% from a year ago, following December's 13.5% increase. In all of last year these exports grew 12.8% from 2003.
As seen in the table below, Texas is the biggest exporting state, with $9.8 billion, representing 14.8% of January's total. In the PORTS database, we see that the Houston District is, as would be expected, the largest volume point of departure; but the Laredo District is also very significant, a circumstance which would highlight the role of NAFTA relationships with Mexico and trade elsewhere in Latin America.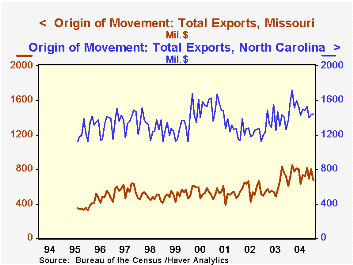
California follows close behind, shipping $8.72 billion in January. Then there is a big gap to number 3 New York, with $3.86 billion in shipments. We've included a couple of other states in our table to illustrate various magnitudes. Virtually every state exports something, although for a few, it can be well under $100 million each month. These data became important a number of years ago to illustrate the significance of sales abroad for local and regional economies. Indeed, 22 states have exports that have recently been averaging over $1 billion a month. This dataset includes, by the way, the District of Columbia, Puerto Rico and the Virgin Islands. "Origin of Movement" classifies this information according to the location where shipping began; this is more reliable than the location of the exporter, since that may not be close to the place where the goods are actually produced and shipped.
Haver's software, DLXVG3, makes comparisons among the states simple. We used the "Excel Mode" to insert codes for all 53 of these these states and locales into a spreadsheet with one quick operation, and then applied a regular DLX retrieval operation to bring the data in. Excel's sorting capabilities make it easy to rank the states.
| Exports by State Billions of $ |
10-Yr Avg | Jan 2005 | Dec 2004 | Year Ago | Monthly Average|||
|---|---|---|---|---|---|---|---|
| 2004 | 2003 | 2002 | |||||
| Total | -- | 66.38 | 71.68 | 59.16 | 68.05 | 60.31 | 57.77 |
| % Change | 3.4 | 12.2 | 13.5 | 8.1 | 12.8 | 4.4 | -5.2 |
| Texas (1) | -- | 9.82 | 10.11 | 8.75 | 9.76 | 8.24 | 7.95 |
| % Change | 8.4 | 12.3 | 19.0 | 9.9 | 18.5 | 3.6 | 0.4 |
| California (2) | -- | 8.72 | 9.75 | 7.98 | 9.16 | 7.83 | 7.68 |
| % Change | 3.7 | 9.3 | 8.0 | 16.5 | 16.9 | 1.9 | -13.6 |
| New York (3) | -- | 3.86 | 4.09 | 2.95 | 3.69 | 3.27 | 3.08 |
| % Change | 5.2 | 30.8 | 19.4 | 1.4 | 13.1 | 6.0 | -12.3 |
| North Carolina (15) | -- | 1.44 | 1.43 | 1.36 | 1.51 | 1.35 | 1.23 |
| % Change | 3.0 | 5.4 | 13.3 | 14.8 | 11.6 | 10.1 | -12.4 |
| Missouri (27) | -- | 0.69 | 0.80 | 0.61 | 0.75 | 0.60 | 0.57 |

Tom Moeller
AuthorMore in Author Profile »Prior to joining Haver Analytics in 2000, Mr. Moeller worked as the Economist at Chancellor Capital Management from 1985 to 1999. There, he developed comprehensive economic forecasts and interpreted economic data for equity and fixed income portfolio managers. Also at Chancellor, Mr. Moeller worked as an equity analyst and was responsible for researching and rating companies in the economically sensitive automobile and housing industries for investment in Chancellor’s equity portfolio. Prior to joining Chancellor, Mr. Moeller was an Economist at Citibank from 1979 to 1984. He also analyzed pricing behavior in the metals industry for the Council on Wage and Price Stability in Washington, D.C. In 1999, Mr. Moeller received the award for most accurate forecast from the Forecasters' Club of New York. From 1990 to 1992 he was President of the New York Association for Business Economists. Mr. Moeller earned an M.B.A. in Finance from Fordham University, where he graduated in 1987. He holds a Bachelor of Arts in Economics from George Washington University.
More Economy in Brief


