 Global| Feb 09 2010
U.S. Small Business OptimismImproves Modestly
by:Tom Moeller
|in:Economy in Brief
Summary
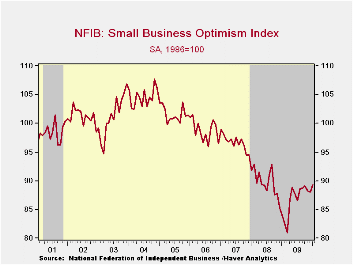
A sense of modest improvement returned to small business. The National Federation of Independent Business (NFIB) reported their January small business optimism index made up the prior two months' declines with an increase to 88.0. [...]
 A
sense of
modest improvement returned to small business. The National Federation
of Independent Business (NFIB) reported their January small business
optimism index made up the prior two months' declines with an increase
to 88.0. During the last ten years, there has been an 85% correlation
between the level of the NFIB index and the two-quarter change in real
GDP.
A
sense of
modest improvement returned to small business. The National Federation
of Independent Business (NFIB) reported their January small business
optimism index made up the prior two months' declines with an increase
to 88.0. During the last ten years, there has been an 85% correlation
between the level of the NFIB index and the two-quarter change in real
GDP.
Two factors drove the overall improvement -- sales expectations & credit. The percentage of firms expecting higher real sales in six months increased to its highest level in two years. Also, the rate of inventory decumulation was slowed to meet those sales and the inventory index rose to the highest since last February. Finally, credit loosened. The percentage of firms reporting that credit was harder to get eased m/m to a net -13 but that still was near the series' low. That credit may have been used to finance higher capital expenditures.
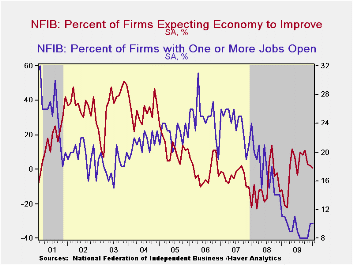
Offsetting these gains was the percentage of small businesses expecting the overall economy to improve dipped slightly m/m to 1 after a sharp November decline. The latest was down from the May high of 12 but well improved from last year's recession low. The percentage which thought that now was a good time to expand the business fell to its lowest level since August. Also, hiring intentions remained weak. The percentage of firms planning to raise employment remained in net-layoff, though it has improved from the March low. For now, the percentage of firms with one or more job openings remained stable m/m at 10% during January. During the last ten years there has been a 74% correlation between the NFIB employment percentage and the six-month change in nonfarm payrolls.
On the pricing front, weakness continued. The percentage of firms actually raising prices stood at -18% (indicating deflation). It's improved slightly from the prior several months but remains near the record low. During the last ten years there has been a 60% correlation between the six-month change in the producer price index and the level of the NFIB price index. The percentage of firms planning to raise prices also improved to its highest level since late-2008. Finally, the percentage planning to raise worker compensation fell to 1.
The most important problems seen by business were poor sales (31%), taxes (22%, close to its highest level since 2007), government requirements (13%), insurance cost & availability (8%), competition from large businesses (7%) and inflation (3%).
About 24 million small businesses exist in the United States. Small business creates 80% of all new jobs in America and the NFIB figures can be found in Haver's SURVEYS database.
Controlling Risk in a lightening speed trading environment from the Federal Reserve Bank of Chicago is available here.

| Nat'l Federation of Independent Business | January | December | November | Jan.'09 | 2009 | 2008 | 2007 |
|---|---|---|---|---|---|---|---|
| Small Business Optimism Index (SA, 1986=100) | 89.3 | 88.0 | 88.3 | 84.1 | 86.7 | 89.8 | 96.7 |
| Percent of Firms Expecting Economy To Improve | 1 | 2 | 3 | -12 | -0 | -10 | -4 |
| Percent of Firms With One or More Job Openings | 10 | 10 | 8 | 11 | 9 | 18 | 24 |
| Percent of Firms Reporting That Credit Was Harder To Get | 14 | 15 | 15 | 13 | 14 | 9 | 6 |
| Percent of Firms Raising Avg. Selling Pric1es (Net) | -18 | -22 | -17 | -15 | -20 | 17 | 15 |
by Tom Moeller February 09, 2010
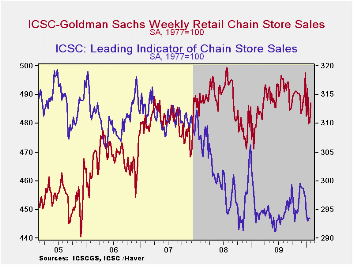
Consumer spending has recovered from its post-holiday slump, but real life is not yet apparent. Weekly chain store sales improved last week although the 1.4% w/w rise left purchases up just slightly from the January average. That average had been boosted by price discounting early in the month.
The ICSC-Goldman Sachs retail chain-store sales index is constructed using the same-store sales (stores open for one year) reported by 78 stores of seven retailers: Dayton Hudson, Federated, Kmart, May, J.C. Penney, Sears and Wal-Mart.
During the last ten years there has been a 69% correlation between the year-to-year growth in chain store sales and the growth in general merchandise retail sales. The weekly figures are available in Haver's SURVEYW database.Also suffering from post-Holiday blues was the leading indicator of chain store sales. It's been roughly unchanged during the last two weeks following four weeks of sharp decline. This composite leading economic indicator is compiled from four series: (1) the MBA's volume index of mortgage applications for home purchase (2) the ABC News/Money magazine's survey of consumer buying conditions (3) new filings for jobless benefits and (4) the 30-year government bond yield.
| ICSC-UBS (SA, 1977=100) | 02/06/10 | 01/30/10 | 01/23/10 | Y/Y | 2009 | 2008 | 2007 |
|---|---|---|---|---|---|---|---|
| Total Weekly Chain Store Sales | 487.1 | 480.4 | 479.8 | 1.8% | 0.1% | 1.4% | 2.8% |
by Tom Moeller February 09, 2010
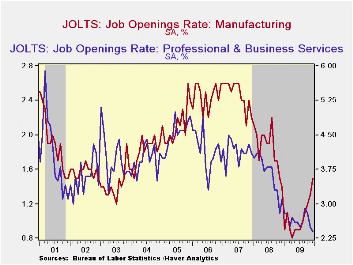
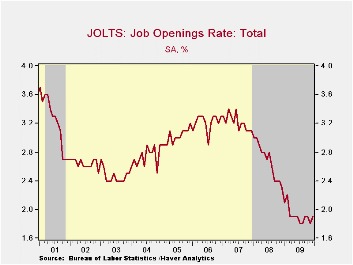 The
Bureau
of Labor Statistics indicated that job market conditions changed little
during December. The latest Job Openings & Labor Turnover
Survey (JOLTS) indicated that though the job openings rate ticked
up to 1.9%, it remained off sharply from the 3.1% rate when the current
recession began. The job openings rate is the number of job
openings on the last business day of the month as a percent of total
employment plus job openings. Job
availability rose 2.6% from November after two months of decline, and
remained off 22.5% year-to-year. The series dates back to December
2000.
The
Bureau
of Labor Statistics indicated that job market conditions changed little
during December. The latest Job Openings & Labor Turnover
Survey (JOLTS) indicated that though the job openings rate ticked
up to 1.9%, it remained off sharply from the 3.1% rate when the current
recession began. The job openings rate is the number of job
openings on the last business day of the month as a percent of total
employment plus job openings. Job
availability rose 2.6% from November after two months of decline, and
remained off 22.5% year-to-year. The series dates back to December
2000.
Earlier weakness in the service sector stabilized last month. Leisure & hospitality job openings ticked up 2.2% (-25.7% y/y), and educational & health service jobs rose 1.3% (-19.7% y/y). Finally, the number of government sector job openings ticked up 0.6% (-0.6% y/y). Offsetting these gains was a 3.7% (-26.2% y/y) decline in the number of professional & business service jobs. That was down for the third straight month. Though the number of retail job openings rose 24.9% (-27% y/y) that just made up a November decline. Countering weakness in service sector hiring was the factory sector where job openings rose for the fifth consecutive month and were off a lessened 6.9% y/y. Construction sector job openings posted a sharp 29.3% decline (-19.7% y/y) which reversed most of the prior four months' increases.
The hires rate remained stable for the fifth straight month at 3.1% but was slightly improved from the series' low of 3.0% last spring. The hires rate is the number of hires during the month divided by employment. The actual number of hires fell 1.3% m/m but was down 9.6% year-to-year. Professional & business service sector hires fell to the lowest level since June with an 18.2% decline (-15.9% y/y) while leisure & hospitality hires fell 2.7% (-3.8% y/y). Factory sector hiring fell 6.0% and was off a diminished 6.0% y/y however construction sector hiring rose 10.5% m/m (-2.2% y/y).
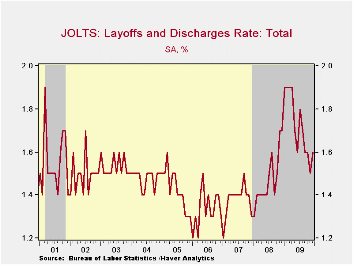
The job separations rate fell back to the series' low of 3.2% with the actual number of separations off 14.5% year-to-year. Separations include quits, layoffs, discharges, and other separations as well as retirements. The layoff rate alone ticked up to 1.6% but was down sharply from the January high of 1.9%.
The JOLTS survey dates only to December 2000 but has followed the movement in nonfarm payrolls, though the actual correlation between the two series is low.· A description of the Jolts survey and the latest release from the U.S. Department of Labor is available here and the figures are available in Haver's USECON database.
| JOLTS (Job Openings & Labor Turnover Survey) | December | November | October | Dec. '08 | 2009 | 2008 | 2007 |
|---|---|---|---|---|---|---|---|
| Job Openings, Total | |||||||
| Rate (%) | 1.9 | 1.8 | 1.9 | 2.3 | 1.9 | 2.3 | 3.1 |
| Total (000s) | 2,497 | 2,434 | 2,571 | 3,224 | 2,497 | 3,224 | 4,382 |
| Hires, Total | |||||||
| Rate (%) | 3.1 | 3.1 | 3.1 | 3.3 | 37.4 | 41.1 | 46.1 |
| Total (000s) | 4,073 | 4,125 | 4,045 | 4,508 | 49,448 | 56,486 | 63,666 |
| Layoffs & Discharges, Total | |||||||
| Rate (%) | 1.6 | 1.5 | 1.6 | 1.7 | 20.7 | 17.7 | 16.5 |
| Total (000s) | 2,079 | 2,011 | 2,128 | 2,360 | 27,594 | 24,362 | 22,613 |
by Robert Brusca February 9, 2010
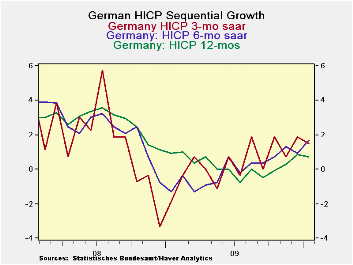
Germany’s HICP and domestic CPI show modest inflation in Germany but headline inflation is still in a steady upward progression. Since the headline rate for the HICP is only 0.7% that is not disturbing at all. The HICP core is not yet available but the domestic German CPI measure shows core inflation at 0.8% Yr/Yr and yet dropping at a pace of 0.8% over the most recent three months. Domestic inflation shows modest diffusion. Inflation is accelerating over six months in only 54% of the categories and inflation is accelerating over three-months in only a bit more than one-quarter of the categories.
Germany, a big part of the e-zone and its inflation measure, shows inflation pressures are still contained but not entirely dormant. At this point that is good news since we want inflation to stay under control but we do not want it so docile that the economy appears to lack any life. The economy needs to make a recovery so the existence of some price pressure is a good signal, too.
Germany has a mixed mission. It is to keep inflation under wraps and still to generate recovery. The German CPI and HICP seem consistent with those goals.
| German HICP and CPI details | |||||||
|---|---|---|---|---|---|---|---|
| Mo/Mo % | Saar % | Yr/Yr | |||||
| Jan-10 | Dec-09 | Nov-09 | 3-Mo | 6-Mo | 12-Mo | Yr Ago | |
| HICP Total | 0.1% | 0.1% | 0.2% | 1.5% | 1.7% | 0.7% | 0.9% |
| Core | #N/A | 0.2% | -0.1% | #N/A | #N/A | #N/A | 1.2% |
| CPI | |||||||
| All | -0.1% | 0.2% | 0.1% | 0.7% | 1.1% | 0.8% | 0.9% |
| CPIxF&E | -0.3% | 0.1% | 0.0% | -0.8% | 0.0% | 0.8% | 1.2% |
| Food | 0.5% | -0.1% | 0.4% | 2.9% | -0.5% | -1.3% | 1.0% |
| Alcohol | 0.1% | 0.1% | -0.1% | 0.4% | 1.1% | 3.6% | 1.9% |
| Clothing & Shoes | -1.9% | 2.2% | -1.3% | -4.2% | 2.8% | 0.3% | 1.0% |
| Rent &Util | 0.1% | 0.1% | 0.0% | 0.7% | 0.7% | -0.3% | 2.4% |
| Health Care | -0.3% | 0.1% | 0.1% | -0.4% | 0.2% | 0.9% | 0.9% |
| Transport | 0.5% | 0.2% | 1.4% | 8.7% | 10.0% | 4.6% | -2.7% |
| Communication | -0.3% | -0.2% | -0.3% | -3.5% | -2.0% | -1.9% | -3.0% |
| Rec &Culture | -0.5% | 0.0% | -0.5% | -3.9% | -1.8% | 0.1% | 1.2% |
| Education | 0.1% | 0.5% | 0.8% | 5.9% | 4.6% | -1.5% | -4.3% |
| Restaurant& Hotel | 0.1% | 0.5% | 0.1% | 2.6% | 2.0% | 1.5% | 3.1% |
| -0.7% | 0.3% | -0.3% | -2.9% | 0.7% | 1.3% | 1.4% | |
| Diffusion | 27.3% | 54.5% | 36.4% | -- | |||
| Type: | Diffusion: Current Compared to | 6-mo | 12-mo | Yr-Ago | -- | ||
by Louise Curley February 10, 2010
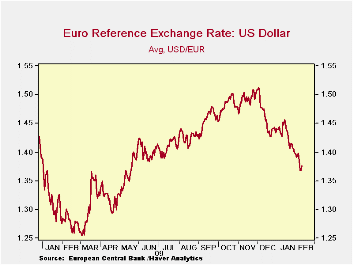
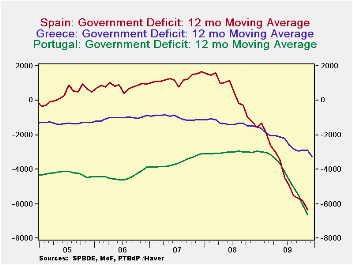 The
budget
crises in Greece, Spain and Portugal have left their mark on the
Euro. The first chart shows the dramatic rise over the past
year or so in the budget deficits of the three countries on a twelve
months moving average basis. By yesterday, the euro had declined
against the dollar by more than 10% from its peak of $1.512 on December
3 of last year. the decline in the euro is shown in the
second chart.
The
budget
crises in Greece, Spain and Portugal have left their mark on the
Euro. The first chart shows the dramatic rise over the past
year or so in the budget deficits of the three countries on a twelve
months moving average basis. By yesterday, the euro had declined
against the dollar by more than 10% from its peak of $1.512 on December
3 of last year. the decline in the euro is shown in the
second chart.
The euro gained some ground today as the talk of possible ways to resolve the budget problems has begun to drown out the talk of doomsday. Nevertheless, the euro is likely to remain under pressure until an accommodation to the problem can be seen. .Pressure on the euro could prove to be not such a bad thing. Europeans have been complaining that the strong euro has affected the demand for their exports adversely. A lower euro could stimulate demand and increase production, which would provide a better background for working out the budget problems.
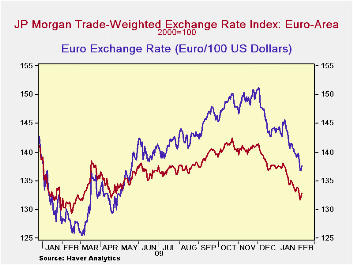
The day to day progress of the euro can be found in The Haver Data Base, INTDAILY. The narrow and broad trade weighted indexes of exchange rates for the Euro Area are also found in this data base. The narrow trade weighted index for the Euro Area is shown in the third chart.

Tom Moeller
AuthorMore in Author Profile »Prior to joining Haver Analytics in 2000, Mr. Moeller worked as the Economist at Chancellor Capital Management from 1985 to 1999. There, he developed comprehensive economic forecasts and interpreted economic data for equity and fixed income portfolio managers. Also at Chancellor, Mr. Moeller worked as an equity analyst and was responsible for researching and rating companies in the economically sensitive automobile and housing industries for investment in Chancellor’s equity portfolio. Prior to joining Chancellor, Mr. Moeller was an Economist at Citibank from 1979 to 1984. He also analyzed pricing behavior in the metals industry for the Council on Wage and Price Stability in Washington, D.C. In 1999, Mr. Moeller received the award for most accurate forecast from the Forecasters' Club of New York. From 1990 to 1992 he was President of the New York Association for Business Economists. Mr. Moeller earned an M.B.A. in Finance from Fordham University, where he graduated in 1987. He holds a Bachelor of Arts in Economics from George Washington University.
More Economy in Brief


