 Global| Dec 13 2006
U.S. Retail Sales Recovered
by:Tom Moeller
|in:Economy in Brief
Summary
US retail sales last month recovered all of the weakness during the prior three months. Sales rose 1.0% following a 0.1% decline in October and a 0.6% shortfall in September which both were revised slightly shallower. The November [...]
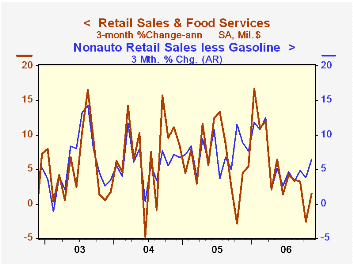
US retail sales last month recovered all of the weakness during the prior three months. Sales rose 1.0% following a 0.1% decline in October and a 0.6% shortfall in September which both were revised slightly shallower. The November increase easily beat Consensus expectations for a 0.2% rise.
Sales by motor vehicle & parts dealers rose 0.9% (6.4% y/y) after an upwardly revised 1.0% October gain. New unit vehicle sales, however, fell 0.7% to 16.04M for the third decline in the last four months. Excluding autos, retail sales surged 1.1% after a slightly revised 0.3% October dip.
Sales of some discretionary items recovered. Sales at furniture, home furnishings & appliance stores surged 2.1% (6.7% y/y) after an unrevised 0.4% October drop. Also up were building material sales which jumped 1.8% (4.2% y/y). Sales of nonstore retailers (internet & catalogue) made up for weakness during the prior three months with a 1.3% (10.1% y/y) jump. 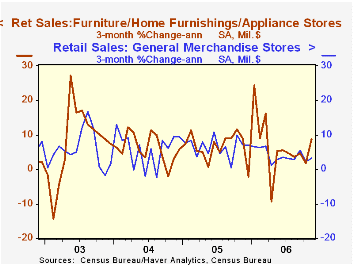
Restaurant and bar sales rose 0.7% (7.9% y/y) after firm gains during the prior four months.
Still lagging, however, were apparel store sales which fell marginally (+6.7% y/y) after a 0.6% decline during October and, with a 0.4% (3.8% y/y) increase, sales at general merchandise stores recovered an unrevised 0.3% October decline.
Sales at gasoline service stations recovered 2.3% after three months of decline though gasoline prices slipped another 0.7% last month to $2.23 per gallon.Nonauto retail sales less gasoline in November jumped 0.9% (6.4% y/y), triple the 0.3% increases during each of the prior three months. During the last three months these sales rose at a 6.5% annual rate, the best since March.
| November | October | Y/Y | 2005 | 2004 | 2003 | |
|---|---|---|---|---|---|---|
| Retail Sales & Food Services | 1.0% | -0.1% | 5.6% | 7.2% | 6.2% | 4.2% |
| Excluding Autos | 1.1% | -0.3% | 5.3% | 8.2% | 7.2% | 4.7% |
by Tom Moeller December 13, 2006
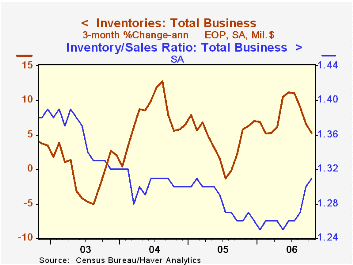
Total business inventories rose an expected 0.4% in October, a bit above a downwardly revised 0.3% September increase. Over the last three months the 0.4% average increase was the slowest since March.
During the last ten years there has been a 57% correlation between the y/y change in business inventories and the change in factory sector industrial production. Using quarterly figures, there has been an 84% correlation between the change in real private nonfarm inventories and production.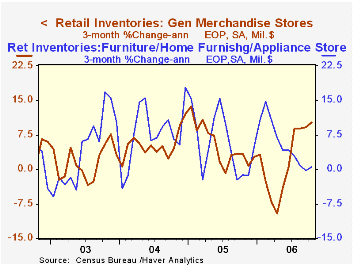
Business sales fell 0.2% (+3.6% y/y) after a 2.3% September decline. Manufacturers' sales recovered all of 0.1% after the 4.2% September drop. Retail sales fell 0.1% (+4.6% y/y) and wholesale sales fell 0.5% (+5.9% y/y) after a 1.5% September drop. As a result the inventory to sales ratio rose to 1.31.
Retail inventories were unchanged but excluding autos they rose 0.3% after an upwardly revised 0.2% September gain. General merchandise inventories surged 1.2% (2.9% y/y) and have been accumulating strongly since May. Accumulation of clothing store inventories also was firm at 0.8% (7.2% y/y). Furniture inventories rose a moderate 0.3% (5.2% y/y).
| Business Inventories | October | September | Y/Y | 2005 | 2004 | 2003 |
|---|---|---|---|---|---|---|
| Total | 0.4% | 0.3% | 7.3% | 4.4% | 7.6% | -1.0% |
| Retail | 0.0% | -0.3% | 5.4% | 2.7% | 6.7% | 3.8% |
| Retail excl. Autos | 0.3% | 0.2% | 4.8% | 4.5% | 7.1% | 1.9% |
| Wholesale | 0.8% | 0.7% | 10.1% | 7.1% | 9.8% | 1.8% |
| Manufacturing | 0.4% | 0.6% | 7.1% | 4.0% | 6.9% | -7.4% |
by Tom Moeller December 13, 2006
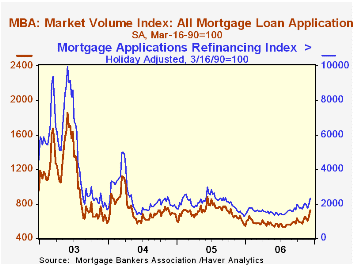
The total number of mortgage applications rose 11.4% last week after an 8.1% rise during the prior period, according to the Mortgage Bankers Association.
Purchase applications continued firm and posted an 8.7% jump after the 4.9% rise during the prior week. The increases lifted purchase applications in December 9.7% above the November average which rose 6.4% from the October level.
During the last ten years there has been a 58% correlation between the y/y change in purchase applications and the change in new plus existing single family home sales.
Applications to refinance logged another double digit increase and jumped 15.8% on the heels of the prior week's 13.7% spike.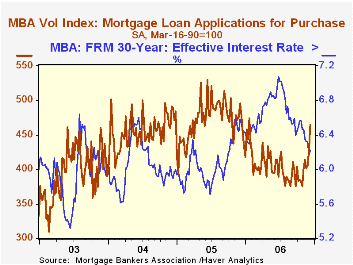
The effective interest rate on a conventional 30-year mortgage increased slightly w/w to 6.22% but the average of 6.19% so far in December is down versus 6.36% during November. The peak for 30 year financing was 7.08% late in June. Rates for 15-year financing also increased to 6.00% and averaged 6.13% last month. Interest rates on 15 and 30 year mortgages are closely correlated (>90%) with the rate on 10 year Treasury securities.
During the last ten years there has been a (negative) 79% correlation between the level of applications for purchase and the effective interest rate on a 30-year mortgage.
The Mortgage Bankers Association surveys between 20 to 35 of the top lenders in the U.S. housing industry to derive its refinance, purchase and market indexes. The weekly survey covers roughly 50% of all U.S. residential mortgage applications processed each week by mortgage banks, commercial banks and thrifts. Visit the Mortgage Bankers Association site here.
| MBA Mortgage Applications (3/16/90=100) | 12/08/06 | 12/01/06 | Y/Y | 2005 | 2004 | 2003 |
|---|---|---|---|---|---|---|
| Total Market Index | 721.2 | 647.6 | 16.5% | 708.6 | 735.1 | 1,067.9 |
| Purchase | 463.8 | 426.6 | -3.0% | 470.9 | 454.5 | 395.1 |
| Refinancing | 2,304.4 | 1,989.7 | 59.8% | 2,092.3 | 2,366.8 | 4,981.8 |
by Tom Moeller December 13, 2006
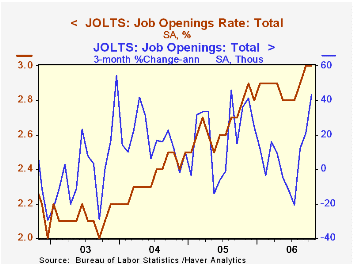
The Bureau of Labor Statistics reported in the Job Openings & Labor Turnover Survey (JOLTS) that the October job openings rate was stable with the prior month at an elevated 3.0%. The job openings rate is the number of job openings on the last business day of the month as a percent of total employment plus job openings.
The actual number of job openings increased 1.3% m/m to 4.207 million (8.8% y/y) and three month growth surged.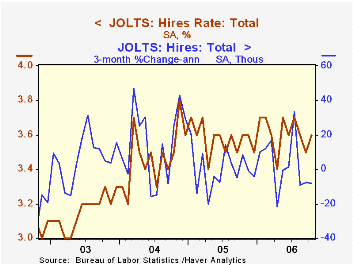
The hires rate improved m/m to 3.6%, the same as averaged during 2Q & 3Q. The hires rate is the number of hires during the month divided by employment.
The actual number of hires increased 1.9% (1.5% y/y) to 4.893 million but it was the first increase in the last three months.
The job separations rate was stable for the third month in October at 3.2%. Separations include quits, layoffs, discharges, and other separations as well as retirements. The total separations, or turnover, rate is the total number of separations during the month divided by employment. The level of job separations increased a very slight 0.1% (0.6% y/y) for only the first increase in the last five months.
The survey dates only to December 2000 but has since followed the movement in nonfarm payrolls.
A description of the Jolts survey and the latest release from the U.S. Department of Labor is available here.
| JOLTS (Job Openings & Labor Turnover Survey) | October | September | Oct '05 | 2005 | 2004 | 2003 |
|---|---|---|---|---|---|---|
| Job Openings Rate: Total | 3.0% | 3.0% | 2.8% | 2.7% | 2.4% | 2.1% |
| Hires Rate: Total | 3.6% | 3.5% | 3.6% | 3.6% | 3.5% | 3.2% |
by Carol Stone December 13, 2006
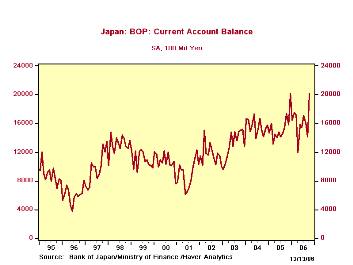
Japan's current account surplus rose ¥611.4 billion in October, according to data reported December 13 by the Ministry of Finance, reaching a record ¥2,020.1 billion (seasonally adjusted).The previous record was ¥2,015.1 billion in December 2005.
The month-to-month increase in the surplus included favorable moves in every segment of the current account.The goods balance increased to ¥852.7 billion from ¥437.2 billion, more than reversing September's shrinkage.Exports rose ¥113.0 billion or 1.9% and imports fell ¥302.5 billion or 5.4%.The merchandise trade data reported earlier indicate that just under half of the fall in imports was in "mineral fuels", including petroleum and natural gas products.Among exports, the strongest items appear to be motor vehicles and metals, as suggested by year/year gains in not-seasonally-adjusted data.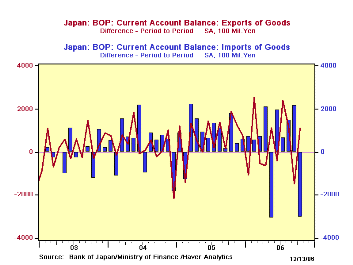
There is a deficit in services, but it shrank markedly in October, to ¥122.8 billion from ¥208.5 billion in September.It is erratic on a monthly basis, but the October reading compares favorably with an average for all of last year of ¥219.4 billion and with ¥308.3 billion in 2004.
The balance on income flows grew as well in October, as gains in assets held abroad are bringing in increased portfolio income. The monthly change in October portfolio income was small, just to ¥1,071.0 billion from ¥1,038.4 billion in September, but these are both up from ¥852.4 billion in October a year ago and ¥737.6 billion for all of 2005.Total income includes interest on bank loans, profits from direct investments, and wage income; the October total was ¥1,374.9 billion.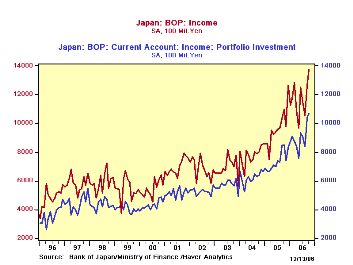
All together in Japan's current account performance for October, the balance of trade in goods showed the largest improvement, but the largest net surplus is in income.As world capital markets become more and more integrated and direct investment becomes more diversified around the world, swings in both goods and income balances are likely to be wider and more frequent.
| JAPAN: SA, Bil.¥ | Oct 2006 | Sept 2006 | Aug 2006 | Year-Ago | Monthly Averages|||
|---|---|---|---|---|---|---|---|
| 2005 | 2004 | 2003 | |||||
| Current Account Balance | 2020.1 | 1408.7 | 1605.0 | 1739.6 | 1537.7 | 1557.4 | 1316.9 |
| Goods Exports | 6134.1 | 6021.1 | 6170.0 | 5510.8 | 5212.5 | 4841.6 | 4303.3 |
| Goods Imports | -122.8 | -208.5 | -169.8 | -54.1 | -219.4 | -308.3 | -300.8 |
| Balance on Services | 1374.9 | 1266.0 | 105.73 | 1099.3 | 966.2 | 776.9 | 692.4 |
| Balance on Income | 1374.9 | 1266.0 | 1057.3 | 1099.3 | 966.2 | 776.9 | 692.4 |
| Portfolio Income | 1071.0 | 1038.4 | 838.2 | 852.4 | 737.6 | 622.8 | 569.9 |

Tom Moeller
AuthorMore in Author Profile »Prior to joining Haver Analytics in 2000, Mr. Moeller worked as the Economist at Chancellor Capital Management from 1985 to 1999. There, he developed comprehensive economic forecasts and interpreted economic data for equity and fixed income portfolio managers. Also at Chancellor, Mr. Moeller worked as an equity analyst and was responsible for researching and rating companies in the economically sensitive automobile and housing industries for investment in Chancellor’s equity portfolio. Prior to joining Chancellor, Mr. Moeller was an Economist at Citibank from 1979 to 1984. He also analyzed pricing behavior in the metals industry for the Council on Wage and Price Stability in Washington, D.C. In 1999, Mr. Moeller received the award for most accurate forecast from the Forecasters' Club of New York. From 1990 to 1992 he was President of the New York Association for Business Economists. Mr. Moeller earned an M.B.A. in Finance from Fordham University, where he graduated in 1987. He holds a Bachelor of Arts in Economics from George Washington University.
More Economy in Brief


