 Global| Mar 12 2009
U.S. Retail Sales Excluding AutosRise; Revisions Sharply Higher
by:Tom Moeller
|in:Economy in Brief
Summary
Consumer spending firmed in the last two months following the notably soft performance during the second half of last year. During February, retail sales excluding autos & gasoline rose 0.5% after a 1.4% January increase which was [...]
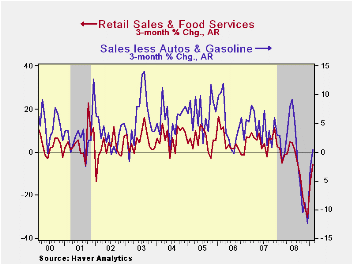
Consumer spending firmed in the last two months following the notably soft performance during the second half of last year. During February, retail sales excluding autos & gasoline rose 0.5% after a 1.4% January increase which was nearly double the gain reported initially.
Overall, retail sales slipped 0.1% in February and that was not far off expectations for a 0.5% decline. However, coupled with a sharp upward revision to the January increase to 1.8% from 1.0%, it left sales for the start of 2009 on a much firmer footing. Consensus expectations had been for a decline of 0.5% in the February sales total. The retail sales data are available in Haver's USECON database.
The rise in total sales came despite another shortfall in motor vehicle purchases. They fell 4.3% and that mirrored the 4.7% m/m drop in unit sales of light vehicles which was reported last week. Gasoline service station sales offset some of that downside surprise. They rose 3.4% (-32.3% y/y) though the gain was boosted by the latest increases in gas prices.
Rebounds in sales were widely evident in this month's report.
Sales at furniture, electronics & appliance stores added 0.9%
to the upwardly revised 3.5% surge during January (6.1% y/y). Furniture
store sales rose for the first month since last April and posted a 0.7%
increase (-10.7% y/y). Sales of electronics & appliances added
1.2% (-1.4% y/y) to their 7.5% January upward spurt.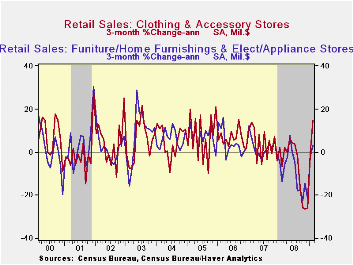
In the soft goods area, apparel store sales added 2.8% (-3.1% y/y) to the upwardly revised 4.9% January gain. At general merchandise stores, sales rose another 1.3% (2.3% y/y) on top of the unrevised 1.1% January increase.Last year apparel store sales fell 9.9% December-to-December and merchandise store sales slipped 0.2%.
Sales at nonstore (internet) retailers have not shared the picture of upside surprise. They rose just 0.3% last month (-0.6% y/y) after a 1.7% January increase which was downwardly revised. Moreover, the interest in dining out slackened and sales fell 0.2% (+2.8% y/y) after a 1.8% January increase.
Building materials sales continued down and posted a 0.2% (-10.3% y/y) decline. It was the seventh consecutive monthly drop.
Detecting Recessions in the Great Moderation: A Real-Time Analysis from the Federal Reserve Bank of Kansas City is available here.
| February | January | December | Y/Y | 2008 | 2007 | 2006 | |
|---|---|---|---|---|---|---|---|
| Retail Sales & Food Services (%) | -0.1 | 1.8 | -3.1 | -8.6 | -0.4 | 4.2 | 5.8 |
| Excluding Autos | 0.7 | 1.6 | -3.2 | -5.0 | 2.8 | 4.6 | 6.8 |
| Less Gasoline | 0.5 | 1.4 | -1.8 | -0.6 | 1.8 | 4.2 | 6.2 |
by Tom Moeller March 12, 2009
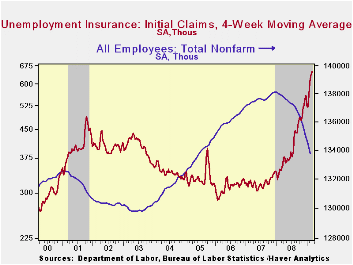
The U.S. job market continues to worsen. Continuing claims for unemployment insurance reached another record level as they jumped by 193,000. At 5,317,000, the level of continuing claims was nearly double that of last March. The series dates back to 1966. The four-week average of continuing claims jumped 124,300 to 5,139,750. That was the third largest move upward on record. Continuing claims provide some indication of workers' ability to find employment and they lag the initial claims figures by one week.
The picture of labor market weakness was reinforced by a 9,000
increase in initial claims for unemployment insurance to 654,000. That
increase followed a 25,000 decline during the prior week which was less
than reported initially. The latest reading compared to Consensus
expectations for 640,000 initial claims.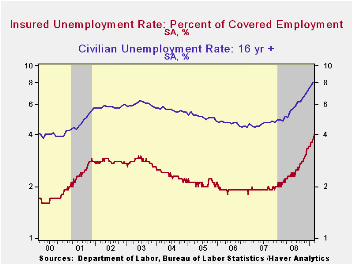
Initial claims in the week ending February 28 rose in New York (+16,481), California (+7,765), Oregon (+4,001), Georgia (+3,313), and Wisconsin (+3,006), while the largest decreases were in Missouri (-3,350), Massachusetts (-3,263), New Jersey (-1,973), Florida (-1,559), and New Mexico (-1,005).
Though the latest level of continuing claims was a record, the labor force has grown as well, by nearly 30% over the last twenty years. Therefore, the insured rate of unemployment is not at a record high. Nevertheless it rose to 4.0% which was the highest since June of 1983. During the last ten years there has been a 93% correlation between the level of the insured unemployment rate and the overall rate of unemployment published by the Bureau of Labor Statistics. The highest insured rates of unemployment in the week ending February 21 were in Michigan (7.7 percent), Oregon (7.4), Idaho (7.2), Wisconsin (6.7), Rhode Island (6.5), Pennsylvania (6.3), Nevada (6.2), Montana (5.9), Alaska (5.7), Indiana (5.7), Massachusetts (5.7), New Jersey (5.7), and Vermont (5.7).
The unemployment insurance claim data is available in Haver's WEEKLY database.
Comments on the Current Financial Crisis (an Abridged Version) from Dallas Fed President Richard W. Fisher can be found here.
| Unemployment Insurance (000s) | 03/07/09 | 02/28/09 | 02/21/09 | Y/Y | 2008 | 2007 | 2006 |
|---|---|---|---|---|---|---|---|
| Initial Claims | 654 | 645 | 670 | 88.5% | 420 | 321 | 313 |
| Continuing Claims | -- | 5,317 | 5,124 | 90.3% | 3,342 | 2,552 | 2,459 |
by Tom Moeller March 12, 2009
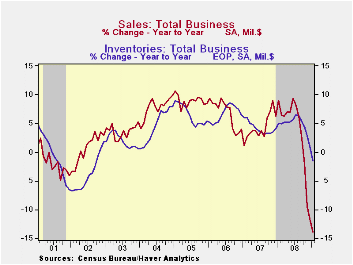
Reduced inventory accumulation has played a large role in the current downturn in economic activity. Business inventories dropped 1.1% m/m during January and the decline marked the fifth consecutive reduction. Over just the last three months inventories have fallen at a 14.1% annual rate, a record for the series which dates back to 1980.
The inventory correction is in response to the downturn in total business sales (not to mention the weakness in pricing). Sales fell 1.0% during January and they were down at a 34.0% annual rate over the last three months. Manufacturers, wholesalers and retailers have suffered with retail sales down at a 15.8% rate during the three months ended January. Wholesalers' sales dropped at a 43.4% rate, though that was inflated by the decline in oil prices. Factory shipments dropped at a 37.8% rate.
Retailers' inventories cratered 1.7% during January, not much
different from the December drop. Emphasizing how little inventories
are wanted, the three-month rate of decline soared to an 18.2% annual
rate, a record. As might be expected, the motor vehicle sector has shed
lots of unsold vehicles from inventory. They're down at a 31.2% rate
since the fall. But it's outside the auto sector where the inventory
decumulation has been notable. Nonauto retail inventories fell 0.5% in
January and at a record 11.8% annual rate during the last three months.
Furniture inventories have been dropped at a 28.8% annual rate during
the last three months while there's been a 13.7% rate of inventory
reduction amongst general merchandise retailers. Rounding out the
picture is a 7.7% rate of decline amongst apparel sellers. These
inventory cuts went some distance in reducing the level of retail
inventories relative to sales, but at 1.55 the ratio was still quite
elevated versus the lows of 1.45 last year.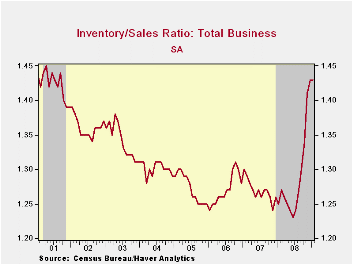
Wholesale inventories dropped 0.7% during January but the decline left them still up 1.0% from last year. To figure whether there still is much of a correction yet to go in this sector it's best to take a look at what is happening excluding petroleum. The pipeline inventory swings can be dramatic and thus distort the overall picture. Indeed, the figures less oil indicate that a correction of inventories has begun at the wholesale level. Nonoil wholesale inventories dropped 1.1% during January for the fifth consecutive monthly decline. The 11.9% rate of decline over the last three months is striking and a record.
Factory inventories, reported last week, fell sharply again. The 0.8% monthly decline was the fifth in a row.
Input and output inventory dynamics from the Federal Reserve Bank of San Francisco is available here.
| Business Inventories (%) | January | December | Y/Y | 2008 | 2007 | 2006 |
|---|---|---|---|---|---|---|
| Total | -1.1 | -1.6 | -1.5 | 0.6 | 4.1 | 6.5 |
| Retail | -1.7 | -1.5 | -5.2 | -3.2 | 2.9 | 3.5 |
| Retail excl. Auto | -0.5 | -1.2 | -2.7 | -1.8 | 2.9 | 4.9 |
| Wholesale | -0.7 | -1.5 | 1.0 | 3.4 | 5.9 | 8.3 |
| Manufacturing | -0.8 | -1.9 | 0.0 | 2.1 | 3.7 | 8.2 |
by Tom Moeller March 12, 2009
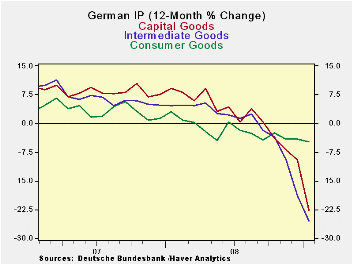
Among large EU economies that have reported results, Germany
shows the fastest dropping industrial production over three-months as
well as in the quarter-to-date. Its 8.1% plunge in MFG IP is right in
line with the reported 8% drop in new orders. The new orders series
continues to point to an accelerating pace of decline in the months
ahead. Orders have been falling at a faster pace than IP for over a
year as output declines have accelerated. Over three-months the order
drop is at a pace of 60% compared to a drop at a 50% pace for output
itself.
Consumer goods output is proving to be the stalwart of the
recession in Germany. This is not too surprising because the German
consumer has been like a rock, not accelerating spending much in the
economy’s strong phase and now not decelerating much in the down phase.
Still consumer goods output s dropping at a 6.4% pace over three months
and is down by about 5% Yr/Yr. that compares to a better than 50% rate
of decline for capital goods output and a better than 60% rate of
decline for intermediate goods output. Consumer goods are a moderating
factor.
| Total German IP | |||||||
|---|---|---|---|---|---|---|---|
| Saar except m/m | Jan-09 | Dec-08 | Nov-08 | 3-mo | 6-mo | 12-mo | Quarter-to-Date |
| IP total | -7.5% | -3.9% | -4.0% | -47.1% | -30.3% | -19.2% | -51.1% |
| Consumer Goods | -0.4% | 1.4% | -2.6% | -6.4% | -1.5% | -4.8% | -2.1% |
| Capital Goods | -12.3% | -3.2% | -3.0% | -53.9% | -35.1% | -22.8% | -62.4% |
| Intermediary Goods | -8.1% | -9.1% | -6.2% | -62.2% | -43.6% | -25.4% | -64.2% |
| Memo | |||||||
| Construction | -7.8% | 5.9% | 0.3% | -7.8% | 0.4% | -16.4% | -22.2% |
| MFG IP | -8.1% | -4.7% | -4.2% | -50.4% | -32.9% | -20.5% | -54.6% |
| MFG Orders | -8.0% | -7.6% | -6.8% | -60.7% | -51.4% | -35.2% | -62.2% |
by Tom Moeller March 12, 2009
For
the year as a whole, total credit market borrowing grew just 5.5% which
was the weakest advance since 1993. And all sectors pulled back their
borrowing -- except the Federal government whose liabilities grew at a
24.2% rate, nearly a record. Nongovernment domestic liabilities
retreated as the recession forced deleveraging. (Or was it the other
way around?) These liabilities fell slightly, for the first time ever,
during 4Q. 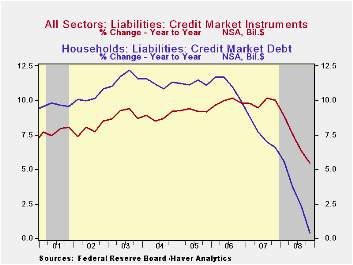 They grew just 2.3% for the year as a whole,
nearly a record low.
They grew just 2.3% for the year as a whole,
nearly a record low.
Borrowing by the household sector evaporated as it posted a nearly unprecedented 0.5% q/q drop. Mortgage borrowing dropped a breathtaking $69.7B (-0.4% y/y) which was nearly double the 3Q drop. Both are records. Consumers' credit liabilities rose a meek $3.9B (1.7% y/y) with growth in spending turning sour. The value of bank loans fell 15.2B (+15.4% y/y) as the credit crunch unfolded.
Credit market debt owed by the financial sector remained strong with a $304.7B increase, though the year-to-year growth rate of 6.4% was roughly half that in 2007. Liabilities at commercial banks rose a much reduced 12.7% y/y while savings institutions liabilities fell by 2.8%. · The liabilities of the foreign sector shrank about as they did during 3Q by $106.7B.
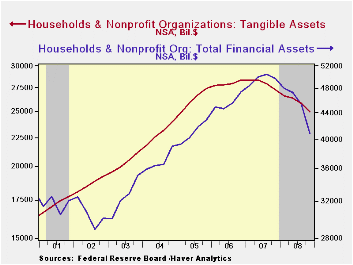
The other side of the balance sheet, of
course, was equally as bleak. The value of the household sector's
financial assets fell by nearly $9 trillion. The value of equity market
shares fell by $3.7 trillion or by 39.9% y/y over the course of the
year and mutual fund share values also fell by one-third or by $900
billion. Pension fund reserves were whacked by $3 trillion during the
year or by 22.4%. Tangible asset values suffered somewhat less than
financial values, but the direction of change was the same. 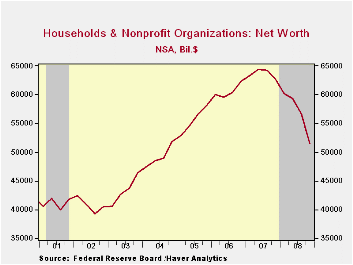 The value
of tangibles overall dropped $2.4 trillion following the $1.1 drop
during 2007. Those declines were nearly all due to the reduction in
real estate values.
The value
of tangibles overall dropped $2.4 trillion following the $1.1 drop
during 2007. Those declines were nearly all due to the reduction in
real estate values.
Lower asset values lowered the net worth of the U.S. household sector last quarter and over the course of the year deteriorated by more by than ten trillion dollars. Household net worth was at it's lowest level since 2003.
Mortgage lending reform is yesterday's House subcommittee testimony by Sandra F. Braunstein, Director, Division of Consumer and Community Affairs, Federal Reserve Board and it can be found here.
| Flow of Funds (Y/Y % Chg.) | % of Total | 4Q '08 | 3Q'08 | 2008 | 2007 | 2006 |
|---|---|---|---|---|---|---|
| Total Credit Market Debt Outstanding | -- | 5.5 | 6.3 | 5.5 | 10.0 | 9.8 |
| Federal Government | 11% | 24.2 | 15.3 | 24.2 | 4.9 | 3.9 |
| Households | 28% | 0.4 | 2.4 | 0.4 | 6.6 | 10.0 |
| Nonfinancial Corporate Business | 13% | 4.7 | 7.3 | 4.7 | 13.5 | 8.5 |
| Nonfarm, NonCorporate Business | 7% | 4.8 | 9.1 | 4.8 | 12.9 | 14.7 |
| Financial Sectors | 32% | 6.4 | 7.2 | 6.4 | 13.3 | 10.0 |
| Net Worth: Households & Nonprofit Organizations (Trillions) | -- | $51.477 | $56.586 | $51.477 | $62.699 | $62.300 |
| Tangible Assets: Households | -- | $24.905 | $25.786 | $24.905 | $27.265 | $28.360 |
| Financial Assets: Households | -- | $40.814 | $45.351 | $40.814 | $49.754 | $47.371 |

Tom Moeller
AuthorMore in Author Profile »Prior to joining Haver Analytics in 2000, Mr. Moeller worked as the Economist at Chancellor Capital Management from 1985 to 1999. There, he developed comprehensive economic forecasts and interpreted economic data for equity and fixed income portfolio managers. Also at Chancellor, Mr. Moeller worked as an equity analyst and was responsible for researching and rating companies in the economically sensitive automobile and housing industries for investment in Chancellor’s equity portfolio. Prior to joining Chancellor, Mr. Moeller was an Economist at Citibank from 1979 to 1984. He also analyzed pricing behavior in the metals industry for the Council on Wage and Price Stability in Washington, D.C. In 1999, Mr. Moeller received the award for most accurate forecast from the Forecasters' Club of New York. From 1990 to 1992 he was President of the New York Association for Business Economists. Mr. Moeller earned an M.B.A. in Finance from Fordham University, where he graduated in 1987. He holds a Bachelor of Arts in Economics from George Washington University.
More Economy in Brief


