 Global| Apr 14 2009
U.S. Retail Sales Backpedal
by:Tom Moeller
|in:Economy in Brief
Summary
The recent recovery in consumer expenditures stuttered last month. March retail sales fell 1.1% after a 0.3% February increase that was revised up slightly. Some of that stutter reflected less money spent on gasoline but it [...]
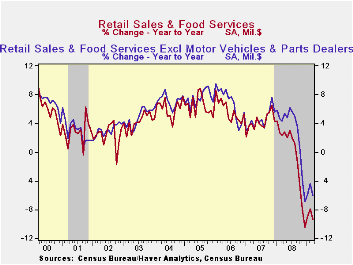
The recent recovery in consumer expenditures stuttered last month. March retail sales fell 1.1% after a 0.3% February increase that was revised up slightly. Some of that stutter reflected less money spent on gasoline but it nevertheless abruptly ended the sales recovery of the prior two months.Moreover, the latest decline in retail sales fell well short of expectations for a 0.3% increase. The retail sales data are available in Haver's USECON database.
Fewer purchases of motor vehicles led the weakness in consumer
spending last month with a 2.3% decline. The decline contrasted with
the 7.8% recovery in unit vehicle sales already reported by automakers
in March. Also somewhat contradictory was a decline of 1.6% in gasoline
service station sales despite a 1.8% rise in gasoline prices.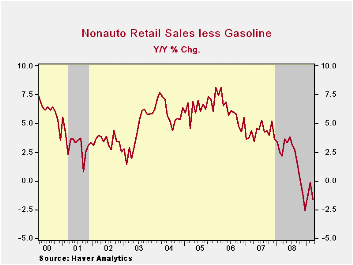
Sales of autos and gasoline were not, however, the main disappointments underlying last month's retail sales report. Sales at furniture, electronics & appliance stores fell 3.8% (-11.3% y/y) and fully retraced the increases of the prior two months. Furniture store sales alone fell 1.7% (-13.1% y/y) after their modest 0.5% February increase while sales of electronics & appliances collapsed by 5.9% (-9.5% y/y), erasing most of the prior two months' gains.
In the soft goods area apparel store sales dropped 1.8% (-5.1% y/y), retracing much of their 2.8% February gain. That decline was accompanied by a 0.2% (+1.3% y/y) downtick in sales at general merchandise stores after two months of strong increase.
And internet purchases suffered as well. Sales at non-store retailers continued their earlier downtrend as they posted a sharp 1.7% drop during March. The downtrend is notable for its duration and magnitude. Year-to-year the decline amounts to 5.0% versus a 2008 gain of 3.7% and the double-digit increases of the prior three years. And dining out did not dull the pain of recession as fewer meals were served outside the home. Restaurant sales reversed their February rise with a 1.4% (+2.2% y/y) March decline.
Building materials sales continued down and posted their eighth consecutive monthly drop. The 0.6% March decline pulled them 9.2% below last year's level.
Four Questions about the Financial Crisis is this mornings speech by Fed Chairman Ben S. Bernanke and it can be found here.
Trends in consumer sentiment and spending from the Federal Reserve Bank of Chicago is available here.
| March | February | January | Y/Y | 2008 | 2007 | 2006 | |
|---|---|---|---|---|---|---|---|
| Retail Sales & Food Services (%) | -1.1 | 0.3 | 1.9 | -9.4 | -0.5 | 4.2 | 5.8 |
| Excluding Autos | -0.9 | 1.0 | 1.6 | -6.0 | 2.8 | 4.6 | 6.8 |
| Less Gasoline | -0.8 | 0.7 | 1.4 | -1.6 | 1.8 | 4.2 | 6.2 |
by Robert Brusca April 14, 2009
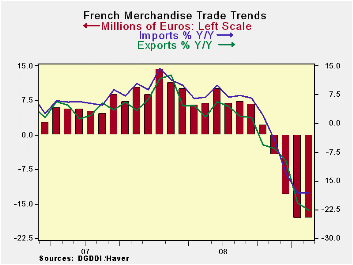
Export and import growth trends in France continue to wither
at very rapid rates. In February exports rose as imports fell by 0.2%.
Still both exports and imports are dropping at better than a 33% annual
rate over three months. The negative rates of growth are actually
accelerating even despite the smaller decline in imports this month and
the rise in exports.
France’s economy continues be under a great deal of pressure.
Declining domestic activity lies behind the drop in French imports as
surely as weak foreign growth lies behind the poor performance of
French exports. French industrial output declined by 0.5% in February
and is off by 15.5% Yr/Yr. meanwhile for all of EMU IP fell by 3.2% in
January and was off by 17.5 Yr/Yr. French exports are facing hostile
international conditions both within the Zone and outside of it.
Despite the bounce in exports in February, it is too soon to be
expecting anything good out of export growth in the immediate future.
| French Trade trends for goods | |||||
|---|---|---|---|---|---|
| m/m% | % Saar | ||||
| Feb-09 | Jan-09 | 3M | 6M | 12M | |
| Balance* | -€€ 4,107.00 | -€€ 3,714.00 | -€€ 3,604.67 | -€€ 4,657.00 | -€€ 4,619.42 |
| Exports | |||||
| All Exp | 1.0% | -11.9% | -34.3% | -33.5% | -23.0% |
| Motor Vehicles | 11.5% | -29.4% | -31.8% | -39.8% | -27.3% |
| IMPORTS | |||||
| All IMP | -0.2% | -2.2% | -33.1% | -30.9% | -18.1% |
| Motor Vehicles | 7.5% | -1.5% | -18.0% | -25.0% | -16.9% |
| *Eur mlns; mo or period average | |||||
by Tom Moeller April 14, 2009
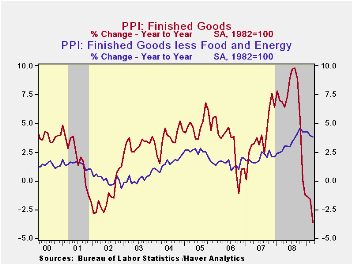
U.S. producer prices for finished goods fell last month for
the first time this year. The 1.2% decrease followed the 0.1% February
uptick and it contrasted with Consensus expectations for no change in
last month's index level. The decline was led by finished energy prices
which fell for the first time in three months. They posted a 12.1%
(-25.5% y/y) drop. Finished gasoline prices fell 13.1% which was the
first since December (-50.7% y/y) while home heating oil prices fell
another 13.2% (-57.0% y/y). Natural gas prices dropped 2.4% (-8.2% y/y).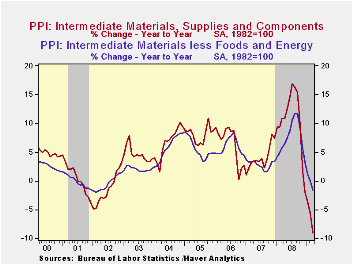
Prices of core finished consumer goods rose just 0.1% (4.1% y/y) after the strong 0.4% February rise. Durable consumer goods prices were unchanged for the weakest reading since November (+3.0% y/y) while core nondurable goods prices increased another 0.3% (5.1% y/y). Finally, capital equipment prices fell for the first time since the end of 2007. A drop of 0.2% shaved its year-to-year gain to 3.4%, down from its high of 4.3% last October.
Prices for finished foods continued lower with a 0.7% decline (-1.0% y/y). The drop was led by lower meat (-11.1% y/y) and dairy product costs (-15.1% y/y).
Falling again were prices for intermediate goods which should
foreshadow even lower finished goods prices. Intermediate goods prices
nearly doubled their February decline with a 1.5% drop and the 9.0% y/y
shortfall was a record. Excluding food & energy, prices also
remained weak as they posted a 0.3% drop, their sixth monthly decline.
The 1.6% y/y decline remained the weakest change in prices since early
2002.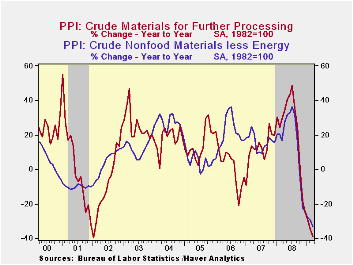
The crude materials PPI dipped again as economic growth continued negative. Down 0.3%, the overall drop reflected a 1.6% decline in core pricing which pulled prices down by one-third from the year ago level. Copper prices are down by more than half from last year as are steel scrap and aluminum prices.
The Producer Price Index data is available in Haver's USECON database. More detailed data is in the PPI and in the PPIR databases.
Rethinking the Implications of Monetary Policy: How a Transactions Role for Money Transforms the Predictions of Our Leading Models from the Federal Reserve Bank of Philadelphia can be found here.
| Producer Price Index (%) | March | February | Y/Y | 2008 | 2007 | 2006 |
|---|---|---|---|---|---|---|
| Finished Goods | -1.2 | 0.1 | -3.6 | 6.4 | 3.9 | 2.9 |
| Core | 0.0 | 0.2 | 3.8 | 3.4 | 2.0 | 1.5 |
| Intermediate Goods | -1.5 | -0.9 | -9.0 | 10.5 | 4.0 | 6.4 |
| Core | -0.3 | -0.6 | -1.6 | 7.6 | 2.8 | 6.0 |
| Crude Goods | -0.3 | -4.5 | -38.9 | 21.2 | 11.9 | 1.4 |
| Core | -1.6 | 1.5 | -33.1 | 15.0 | 15.6 | 20.8 |
by Tom Moeller April 14, 2009
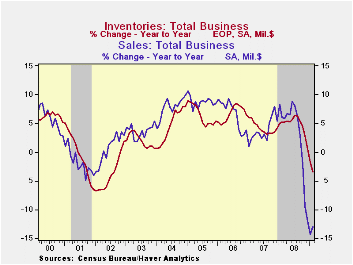
Inventory decumulation remains a dominant trend behind the current economic downturn. Decumulation subtracted 0.3 percentage points from GDP growth last year after a 0.4 percentage point subtraction in 2007, even before the recession started. That degree of subtraction probably intensified early this year. Business inventories dropped 1.3% m/m during February. The decline followed a similar January shortfall and it was the sixth consecutive monthly dip. Over just the last three months, inventories have fallen at a 15.2% annual rate, a record for the series which dates back to 1980.
Lower business sales (not to mention the weakness in pricing) continues to propel the inventory correction. Though sales rose 0.2% in February they are down at a 16.2% annual rate over the last three months. The only good news is that the recent rate of decline in sales eased to -16.2% from the peak -40.7% rate this past fall.
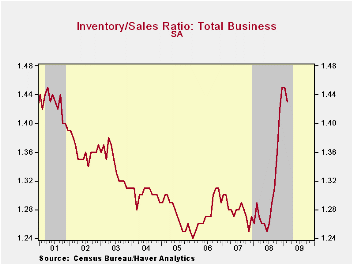
Retailers' inventories fell another sharp 1.2% during February. The three-month rate of decline remained quite strong at 16.3% which was just off the record. The motor vehicle sector has led that decline, shedding inventories at a 32.1% rate over the last three months. Accentuating the downward trend, non-auto retail inventories fell at an 8.6% rate since the fall. Furniture inventories have been dropped at a 15.7% annual rate during the last three months while there's been a 13.5% rate of inventory reduction amongst general merchandise retailers. Rounding out the picture is a 6.2% rate of decline amongst apparel sellers. These cutbacks have been enough to drop the inventory-to-sales ratio amongst retailers to its lowest level since last September.
The inventory cutbacks overall, however, have done little to reduce the I/S ratio for total business. It remained in February near its highest level since 2001 due the wholesale and the factory sectors.
The Peopling of Macroeconomics: Microeconomics of Aggregate Consumer Expenditures from the Federal Reserve Bank of Philadelphia can be found here.
| Business Inventories (%) | February | January | Y/Y | 2008 | 2007 | 2006 |
|---|---|---|---|---|---|---|
| Total | -1.3 | -1.3 | -3.5 | 0.6 | 4.1 | 6.5 |
| Retail | -1.2 | -1.8 | -6.6 | -3.2 | 2.9 | 3.5 |
| Retail excl. Auto | -0.4 | -0.7 | -3.2 | -1.8 | 2.9 | 4.9 |
| Wholesale | -1.5 | -0.9 | -1.7 | 3.1 | 6.2 | 8.2 |
| Manufacturing | -1.2 | -1.1 | -2.0 | 2.1 | 3.7 | 8.2 |
by Louise Curley April 14, 2009
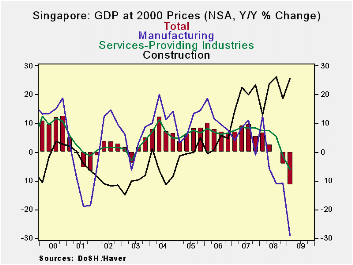
The effect of the recession in the western industrial countries on the export oriented countries in Asia becomes more apparent every day. Today it is Singapore's turn. Advance estimates of Singapore's first quarter Gross Domestic Product show a seasonally adjusted annualrate of decline of 19.7% following a 16.4% rate of decline in the fourth quarter of 2008. (The Advance estimates of GDP for the first quarter of 2009 are computed largely from data for January and February. They are intended to be an early indication of changes in GDP and are subject to revision when more comprehensive data become available.)
On a year over year basis, GDP declined 11.5% in the first quarter, compared with a decline of 4.2% in the fourth quarter. The manufacturing sector, depending heavily on foreign demand, is the worst performing sector. It began to report year over year declines in the second quarter of 2008, and is now reporting a year over year decline of 29% for the first quarter of 2009. The Service industries have been affected by the decline in tourism and in the first quarter of 2009 were 5.9% below the first quarter of 2008. Construction has been the bright spot, showing large year over year increases as a result of a substantial backlog of committed projects in housing and infrastructure. The year to year changes in GDP, Manufacturing, Construction and Services are shown in the attached chart.
The Economic Development Board of Singapore publishes data for what they call "Production Clusters" that is, the output of firms producing some of Singapore's more important exports. There are clusters of Electronics, Chemicals, Biomedicals, Precision Engineering and Transport firms. These data are produced monthly and are an important part of the data on which the advance estimates of GDP are based. The declines in the clusters shown below help explain the sharp drop in manufacturing in the first quarter.
Given the sharp deterioration in Singapore's first quarter GDP and the prospect for continued weak global demand, the Ministry of Trade and Industry has reduced its estimate of GDP for the year 2009 to a range of -6% to -9% from its January 21 estimate of -2% to -5%.
| SINGAPORE | Q1 09 | Q4 08 | Q3 08 | Q2 08 | Q1 08 | 2008 |
|---|---|---|---|---|---|---|
| GDP (y/y % Chg) | -11.5 | -4.2 | 0.0 | 2.5 | 6.7 | 1.1 |
| Manufacturing | -29.0 | -10.7 | -16.0 | -5.6 | 12.6 | -4.1 |
| Construction | 25.6 | 18.5 | 26.0 | 23.7 | 13.1 | 20.3 |
| Services | -5.9 | -1.3 | 5.5 | 7.5 | 7.5 | 4.7 |
| Production Clusters (y/y % Chg) | Feb 09 | Jan 09 | Dec 08 | Nov 08 | Oct 08 | Sep 08 |
| Electronics | -37.26 | -43.43 | -35.37 | -19.92 | -13.40 | -14.49 |
| Chemicals | -22.13 | -24.35 | -23.19 | -20.42 | -7.09 | 3.01 |
| Biomedicals | -27.89 | -30.22 | 21.49 | 18.43 | -29.72 | 43.33 |
| Precision Engineering | -21.41 | -36.83 | -21.69 | -18.53 | -12.50 | -3.46 |
| Transport | 18.34 | 6.31 | 6.42 | 7.51 | 10.62 | 10.26 |

Tom Moeller
AuthorMore in Author Profile »Prior to joining Haver Analytics in 2000, Mr. Moeller worked as the Economist at Chancellor Capital Management from 1985 to 1999. There, he developed comprehensive economic forecasts and interpreted economic data for equity and fixed income portfolio managers. Also at Chancellor, Mr. Moeller worked as an equity analyst and was responsible for researching and rating companies in the economically sensitive automobile and housing industries for investment in Chancellor’s equity portfolio. Prior to joining Chancellor, Mr. Moeller was an Economist at Citibank from 1979 to 1984. He also analyzed pricing behavior in the metals industry for the Council on Wage and Price Stability in Washington, D.C. In 1999, Mr. Moeller received the award for most accurate forecast from the Forecasters' Club of New York. From 1990 to 1992 he was President of the New York Association for Business Economists. Mr. Moeller earned an M.B.A. in Finance from Fordham University, where he graduated in 1987. He holds a Bachelor of Arts in Economics from George Washington University.
More Economy in Brief


