 Global| Apr 22 2010
U.S. PPI Firms; Core Prices Remain Soft
by:Tom Moeller
|in:Economy in Brief
Summary
For finished goods, producer price inflation picked up further last month and pressure is building for future increases. The March finished goods PPI reversed its prior month's decline with a 0.7% increase. As a result,the y/y gain [...]
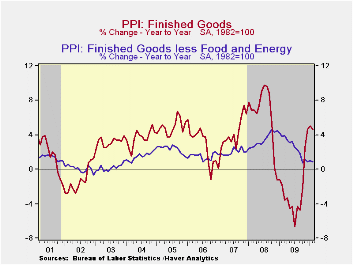
For finished goods, producer price inflation picked up further last month and pressure is building for future increases. The March finished goods PPI reversed its prior month's decline with a 0.7% increase. As a result,the y/y gain remained the strongest in eighteen months. The monthly increase exceeded Consensus expectations for a 0.5% rise.
Higher prices for finished foods was behind the acceleration in the PPI last month with a 2.4% increase (6.7% y/y). Vegetable prices surged by roughly one-half m/m (56.1% y/y), again due to severe weather. Egg prices also jumped by 9.4% and were up by one-third y/y while beef prices firmed for the third consecutive month (10.7% y/y). These gains were tempered by a 1.1% decline (-6.0% y/y) in pasta product prices and a 0.5% decline (-0.5% y/y) in bakery prices.
A moderate 0.7% gain (23.2% y/y) in energy prices recouped a piece of the 2.9% February drop. A strong monthly gain (66.8% y/y) in gasoline prices recovered a February decline while home heating oil prices also firmed (49.9% y/y). Finally, natural gas prices were weak (-5.1% y/y) and electricity prices rose modestly (0.3% y/y).
Finished producer prices excluding food & energy again were weak with an expected 0.1% uptick. The resulting 0.8% y/y increase remained nearly the weakest since early-2004. Continuing to lose steam was the PPI for finished consumer goods less food & energy. It increased just 0.1% (1.4% y/y), half the annual gains during the last two years. Finished durables prices were unchanged (0.6% y/y) while core finished consumer nondurable goods prices gained 0.3% (2.1% y/y), their weakest since early 2007. Capital equipment prices were unchanged (+0.1% y/y).
Upward pressure on finished goods prices to come was suggested by firmer prices for intermediate goods. Their 0.6% increase raised the y/y gain to 7.8%. The 0.4% uptick (26.5% y/y) in energy prices and the 0.5% decline (+2.6% y/y) perhaps belied the degree of pressure. Core prices rose 0.7% and the 4.0% y/y gain was the strongest since late-2008. The strength reflected a 24.2% gain in lumber prices, a one-third increase in organic chemical prices and a one-half y/y price increase in the price of copper & mill shapes. Offsetting these gains was widespread weakness elsewhere.
Additional price pressure to come also may be evident in the 3.2% increase (33.6 y/y) in the crude materials PPI. Energy prices rose by one-half y/y after last year's 43.0% decline. Food prices also were on the rise with an accelerated 12.7% y/y increase led by higher beef & pork prices & higher milk prices. Core crude prices jumped 6.0% as part of a 44.8% y/y increase. That reversed last year's decline. The gain was led by higher aluminum (76.5% y/y) prices and higher scrap copper prices which have doubled. Iron & steel scrap prices also have doubled.
The producer price data is available in Haver's USECON database. More detailed data is in the PPI and in the PPIR databases.
| Producer Price Index(%) | March | February | January | Y/Y | 2009 | 2008 | 2007 |
| Finished Goods | 0.7 | -0.6 | 1.4 | 6.1 | -2.5 | 6.4 | 3.9 |
| Less Food & Energy | 0.1 | 0.1 | 0.3 | 0.8 | 2.6 | 3.4 | 2.0 |
| Intermediate Goods | 0.6 | 0.1 | 1.7 | 7.8 | -8.4 | 10.3 | 4.0 |
| Less Food & Energy | 0.7 | 0.9 | 0.5 | 4.0 | -4.2 | 7.4 | 2.8 |
| Crude Goods | 3.2 | -3.5 | 9.6 | 33.6 | -30.4 | 21.4 | 11.9 |
| Less Food & Energy | 6.0 | -0.6 | 6.6 | 44.8 | -23.5 | 14.8 | 15.6 |
| Producer Price Index(%) | March | February | January | Y/Y | 2009 | 2008 | 2007 |
|---|---|---|---|---|---|---|---|
| Finished Goods | 0.7 | -0.6 | 1.4 | 6.1 | -2.5 | 6.4 | 3.9 |
| Less Food & Energy | 0.1 | 0.1 | 0.3 | 0.8 | 2.6 | 3.4 | 2.0 |
| Intermediate Goods | 0.6 | 0.1 | 1.7 | 7.8 | -8.4 | 10.3 | 4.0 |
| Less Food & Energy | 0.7 | 0.9 | 0.5 | 4.0 | -4.2 | 7.4 | 2.8 |
| Crude Goods | 3.2 | -3.5 | 9.6 | 33.6 | -30.4 | 21.4 | 11.9 |
| Less Food & Energy | 6.0 | -0.6 | 6.6 | 44.8 | -23.5 | 14.8 | 15.6 |
by Tom Moeller April 22, 2010
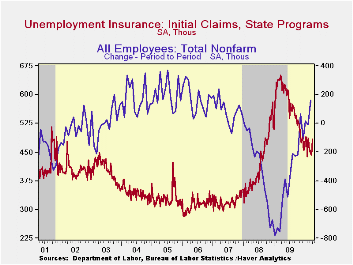
Improvement in the labor market has returned. The Bureau of Labor Statistics reported that initial claims for jobless insurance fell 24,000 to 456,000. It was the lowest level since late last month and about matched expectations for a decline to 450,000 claims. The latest was down from the recession peak of 651,000 reached in March of 2009. The four-week moving average of initial claims rose ever so slightly to 460,250.. The latest figure is for the survey week for April nonfarm payroll employment. Claims rose 2,000 (0.4%) from the March period. During the last ten years there has an 82% correlation between the one-month change in claims and the change in payroll employment.
A 40,000 decline in continuing claims for unemployment insurance during the latest week reversed just some of the prior week's upwardly revised 124,000 increase. Still, they were down by one-third since the late-June peak. The overall decline is a function of the improved job market but also reflects the exhaustion of 26 weeks of unemployment benefits. Continuing claims provide an indication of workers' ability to find employment. The four-week average of continuing claims also fell to a cycle low of 4.644 mil. This series dates back to 1966.
Extended benefits for unemployment insurance jumped to 146,583. Nevertheless, they were down by three-quarters from a peak of 597,688 reached in November.Each state administers a separate unemployment insurance program within guidelines established by Federal law. Benefit amounts and the length of time benefits are received are determined by state law. For example, in Michigan and New York, an additional 73 weeks of benefits are available while in California an additional 79 weeks are available.
The insured unemployment rate slipped to 3.6%. The rate reached a high of 4.9% during May. During the last ten years, there has been a 96% correlation between the level of the insured unemployment rate and the overall rate of unemployment published by the Bureau of Labor Statistics.
The highest insured unemployment rates in the week ending April 3 were in Alaska (6.6 percent), Oregon (6.1), Wisconsin (5.5), Nevada (5.4), Puerto Rico (5.4), Idaho (5.3), Michigan (5.2), Montana (5.2), Pennsylvania (5.1), and North Carolina (5.0). The lowest insured unemployment rates were in Virginia (2.0), Texas (2.2), Georgia (2.9), Florida (3.1), Maryland (3.2), Wyoming (3.3), Ohio (3.6), New York (4.0) and Maine (4.1). These data are not seasonally adjusted but the overall insured unemployment rate is.
The unemployment insurance claims data is available in Haver's WEEKLY database and the state data is in the REGIONW database.
Extended Unemployment and UI Benefits from the Federal Reserve Bank of San Francisco is available here http://www.frbsf.org/publications/economics/letter/2010/el2010-12.html
| Unemployment Insurance (000s) | 04/17/10 | 04/10/10 | 04/03/10 | Y/Y | 2009 | 2008 | 2007 |
|---|---|---|---|---|---|---|---|
| Initial Claims | 456 | 480 | 463 | -28.0% | 572 | 419 | 321 |
| Continuing Claims | -- | 4,646 | 4,686 | -23.2% | 5,809 | 3,340 | 2,549 |
| Insured Unemployment Rate (%) | -- | 3.6 | 3.7 | 4.6 (4/2009) | 4.4 | 2.5 | 1.9 |

Tom Moeller
AuthorMore in Author Profile »Prior to joining Haver Analytics in 2000, Mr. Moeller worked as the Economist at Chancellor Capital Management from 1985 to 1999. There, he developed comprehensive economic forecasts and interpreted economic data for equity and fixed income portfolio managers. Also at Chancellor, Mr. Moeller worked as an equity analyst and was responsible for researching and rating companies in the economically sensitive automobile and housing industries for investment in Chancellor’s equity portfolio. Prior to joining Chancellor, Mr. Moeller was an Economist at Citibank from 1979 to 1984. He also analyzed pricing behavior in the metals industry for the Council on Wage and Price Stability in Washington, D.C. In 1999, Mr. Moeller received the award for most accurate forecast from the Forecasters' Club of New York. From 1990 to 1992 he was President of the New York Association for Business Economists. Mr. Moeller earned an M.B.A. in Finance from Fordham University, where he graduated in 1987. He holds a Bachelor of Arts in Economics from George Washington University.
More Economy in Brief


