 Global| Mar 27 2009
U.S. Personal Spending IncreasesAgain, Modestly
by:Tom Moeller
|in:Economy in Brief
Summary
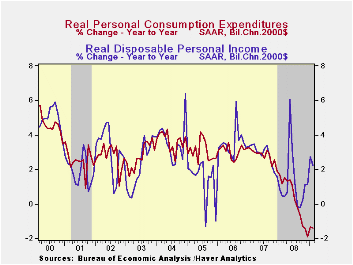
Consumer spending is recovering from its swoon this past Fall. The U.S. Bureau of Economic Analysis reported that personal spending during February logged its second increase after six consecutive monthly declines. That recovery is [...]
 Consumer
spending is recovering from its swoon this past Fall. The U.S. Bureau
of Economic Analysis reported that personal spending during February
logged its second increase after six consecutive monthly declines. That
recovery is hardly robust however. Adjusted for inflation, spending in
fact fell 0.2% last month after January's 0.7% rise. For the quarter so
far, real spending is up at just a 1.3% annual rate which makes up
little of the 4.3% rate of decline during 4Q and the 3.8% 3Q drop.
Consumer
spending is recovering from its swoon this past Fall. The U.S. Bureau
of Economic Analysis reported that personal spending during February
logged its second increase after six consecutive monthly declines. That
recovery is hardly robust however. Adjusted for inflation, spending in
fact fell 0.2% last month after January's 0.7% rise. For the quarter so
far, real spending is up at just a 1.3% annual rate which makes up
little of the 4.3% rate of decline during 4Q and the 3.8% 3Q drop.
Much of the recovery in overall real spending this quarter
traces to
the modest, halting rise in spending on autos, after an abysmal Fall.
Real spending on autos & parts fell 3.9% last month retracing
most of a 5.3% January increase. This flatness follows declines at 10%
to 40% annual rates during each quarter of 2008. Elsewhere, earlier
declines in real outlays indeed may be stabilizing as indicated by two
consecutive firm gains in furniture & appliances spending. But
that's about it for the good news. Real spending on apparel rose all of
0.4% last month after no change during January. It's still down 2.6%
year-to-year. 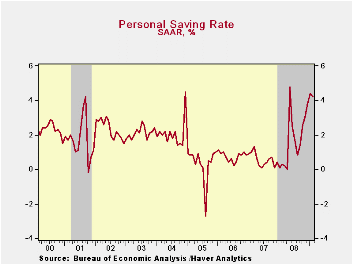 And real spending on services has been modest as well. It
declined 0.1% last month and has been flat since November (+0.7% y/y).
And real spending on services has been modest as well. It
declined 0.1% last month and has been flat since November (+0.7% y/y).
The pullback in personal spending reflects lower levels of personal income. Income declined 0.2% after a 0.2% January increase (that was half the initially reported gain) and is down 1.3% versus its peak last June. The latest decline about equaled the Consensus expectation. Also losing steam, disposable personal income slipped 0.1% after the 1.6% January surge that owed to a 9.7% monthly drop in taxes. Real disposable income also fell by 0.4% after January's gain of 1.3%. Despite the decline, real income increased 2.2% versus last year.
Wages & salaries further reflected the weak job market with a 0.4% decline (-0.2% y/y). So bad are the figures that wage income was down in each of the last four months and at a 4.0% annual rate during that period. That rate is the fastest since 1994. Private sector wages during that period were down at a 6.0% annual rate, also the worst since 1994. These declines contrast to wages in the government sector which continue to increase. A 0.3% February rise pulled wages up 5.1% versus last year.
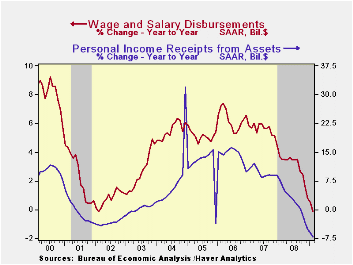 Lower
interest rates continued
to pull interest income down. It has fallen 1.0% to 2.0% during each of
the last five months (-7.2% y/y). In addition, weak corporate profits
lowered dividend income by 1.5%, about the rate of decline since
September and down 7.2% year-to-year.
Lower
interest rates continued
to pull interest income down. It has fallen 1.0% to 2.0% during each of
the last five months (-7.2% y/y). In addition, weak corporate profits
lowered dividend income by 1.5%, about the rate of decline since
September and down 7.2% year-to-year.
The stabilization of oil prices caused the PCE chain price index to rise 0.3% during the last two months. Core pricing power in fact firmed slightly showing two months of 0.2% increase after having been unchanged for two. The latest gain matched Consensus expectations.
The personal income & consumption figures are available in Haver's USECON and USNA databases.
| Disposition of Personal Income (%) | February | January | Y/Y | 2008 | 2007 | 2006 |
|---|---|---|---|---|---|---|
| Personal Income | -0.2 | 0.2 | 1.0 | 3.8 | 6.1 | 7.1 |
| Disposable Personal Income | -0.1 | 1.6 | 3.2 | 4.6 | 5.5 | 6.4 |
| Personal Consumption Expenditures | 0.2 | 1.0 | -0.4 | 3.6 | 5.5 | 5.9 |
| Saving Rate | 4.2 | 4.4 | 0.3 (Feb. 08) | 1.8 | 0.5 | 0.7 |
| PCE Chain Price Index | 0.3 | 0.3 | 1.0 | 3.3 | 2.6 | 2.8 |
| Less food & energy | 0.2 | 0.2 | 1.8 | 2.2 | 2.2 | 2.3 |
by Tom Moeller March 27, 2009
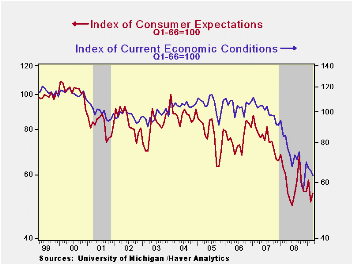
 As reported
mid-month, consumers' moods have stabilized as suggested by the
University of Michigan. It reported that the full month March reading
of consumer sentiment held stable in the range of the last several
months. Despite this stability, however, the latest figure was down
17.6% from last March. During the last ten years, there has been a 63%
correlation between the level of sentiment and the three-month change
in real personal consumption expenditures. The March reading came in
slightly above Consensus expectations.
As reported
mid-month, consumers' moods have stabilized as suggested by the
University of Michigan. It reported that the full month March reading
of consumer sentiment held stable in the range of the last several
months. Despite this stability, however, the latest figure was down
17.6% from last March. During the last ten years, there has been a 63%
correlation between the level of sentiment and the three-month change
in real personal consumption expenditures. The March reading came in
slightly above Consensus expectations.
The expectations component of consumer sentiment firmed a bit and recovered nearly half of the February decline. Expectations for business conditions during the next year led that increase but remained near the lowest level since 1980. Expectations for conditions during the next five years fell slightly to the lowest level since last June.
 The
expected change in personal finances ticked higher.
The
expected change in personal finances ticked higher.
The current economic conditions index also improved slightly from February after an initial reading of sharp decline. Buying conditions for large household goods fell just slightly m/m but they remained down 21.0% from a year earlier. The view of current personal finances also fell and remained down by one-half from early 2007.
The opinion of government policy, which may eventually influence economic expectations, improved sharply to the highest level since January of 2007. Twenty two percent of respondents thought that a good job was being done by government, up from the four percent low of last December, while a much reduced twenty eight percent thought that a poor job was being done.
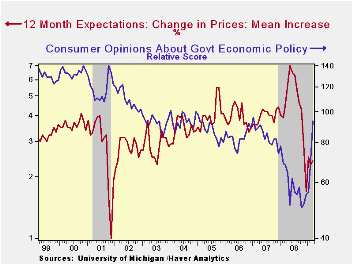 Inflation
expectations for the next year were about stable at 2.4%.
They were as high as 7.0% last May. The range of expectations is from
slight price deflation to a 5.3% increase in prices. The expected
inflation rate during the next five years reversed most of the
increases during the last two months and fell to 2.9%.
Inflation
expectations for the next year were about stable at 2.4%.
They were as high as 7.0% last May. The range of expectations is from
slight price deflation to a 5.3% increase in prices. The expected
inflation rate during the next five years reversed most of the
increases during the last two months and fell to 2.9%.
The University of Michigan survey data is not seasonally adjusted. The reading is based on telephone interviews with about 500 households at month-end; the mid-month results are based on about 300 interviews. The summary indexes are in Haver's USECON database with details in the proprietary UMSCA database.
Payments Fraud: An Introduction from the Federal Reserve Bank of Chicago is available here.
| University of Michigan | March (Final) | Mid-March | February | January | March y/y | 2008 | 2007 | 2006 |
|---|---|---|---|---|---|---|---|---|
| Consumer Sentiment | 57.3 | 56.6 | 56.3 | 61.2 | -17.6% | 63.8 | 85.6 | 87.3 |
| Current Conditions | 63.3 | 62.3 | 65.5 | 66.5 | -24.8 | 73.7 | 101.2 | 105.1 |
| Expectations | 53.5 | 53.0 | 50.5 | 57.8 | -11.0 | 57.3 | 75.6 | 75.9 |
by Robert Brusca March 27, 2009
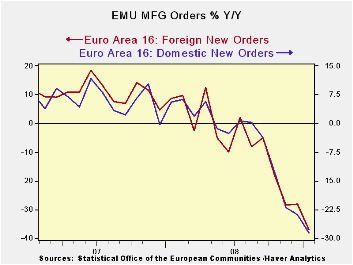
Egad! Still very weak: Euro industrial
orders continued their steep rate of decline in January. The 3.4% mo/mo
drop was less than the 8% plunge in December and the 9.4% stunner in
November, but it fell far short of being reassuring.
Weak Q1 in train, too: The three month pace
of decline is 57% at an annual rate. The rate of decline in the quarter
is also at a -50% annual rate. So 2009-Q1 is not an encouraging number
to look forward to at this point.
Imported weakness for Europe: The
domestic/foreign split for orders is somewhat illuminating. Domestic
orders fell at by 3.9% from December. Foreign orders fell by 7.3%. The
pace of decline for past growth rates also shows that the domestic rate
of decline has lagged the pace of the foreign orders decline. But that
growth gap has become more pronounced this month with domestic orders
off by so much less than foreign orders. Clearly the EMU is importing
weakness from abroad. Its foreign orders and exports are falling at a
faster pace than its domestic activity.
Dissent at home: While the ECB is coming
under more criticism from business groups (today it is Business Europe,
which represents national business federations and industry groups) the
industrial orders data strongly suggest that the pulse of weakness is
from beyond the ECBs border and reach. That does not mean that the ECB
or that fiscal stimulus could not make up for it, but that there is a
continuing drag of controllable influence on the euro-economy.
A glint or two of good news: Still, it is
encouraging that the Markit PMI indices for services and for MFG turned
higher in March. Today the CEPR index of activity echoed that signal
and turned just a little bit less negative in March compared to
February. This sort of statistic is not bankable but it is indicative
of an economy that may be passing from its most severe phase of
negative growth to a milder phase and perhaps eventually headed to
recovery.
Looking ahead to March data… For the bulk
of Euro-data the readings remain dispirited and grim. But the March
reports which are so few in number have begun to stake out a less
negative view. There it is: the precursor to a positive view. Not to
get too excited yet, but this is the way that the rebound will start.
So despite the discouraging data on the day the there is some good news
in train but it’s only found in the freshest of reports. That means we
are apt to see better news for COUNTRY level data first, since the EMU
reports lag the timeliest of national reports.
| E-zone-13 and UK Industrial Orders And Sales | |||||||||
|---|---|---|---|---|---|---|---|---|---|
| Saar except m/m | Mo/Mo | Jan-09 | Dec-08 | Jan-09 | Dec-08 | Jan-09 | Dec-08 | ||
| E- AREA Detail | Jan-09 | Dec-08 | Nov-08 | 3-Mo | 3-Mo | 6-mo | 6-mo | 12-mo | 12-mo |
| MFG Orders | -3.4% | -8.0% | -9.4% | -57.9% | -63.9% | -50.1% | -46.2% | -32.0% | -28.0% |
| MFG Sales | #N/A | -3.5% | -3.9% | #N/A | -34.7% | #N/A | -24.0% | #N/A | -11.6% |
| Consumer | #N/A | -0.4% | -0.4% | #N/A | -4.9% | #N/A | -4.3% | #N/A | -2.9% |
| Capital | #N/A | -1.7% | -2.1% | #N/A | -20.3% | #N/A | -16.1% | #N/A | -8.7% |
| Intermediate | -3.9% | -5.9% | -8.4% | -52.8% | -56.1% | -46.9% | -40.8% | -28.6% | -23.8% |
| Memo: MFG | |||||||||
| Total Orders | -3.4% | -8.0% | -9.4% | -57.9% | -63.9% | -50.1% | -46.2% | -32.0% | -28.0% |
| E-13 Domestic MFG orders | -3.9% | -5.9% | -8.4% | -52.8% | -56.1% | -46.9% | -40.8% | -28.6% | -23.8% |
| E-13 Foreign MFG orders | -7.3% | -7.1% | -10.3% | -64.4% | -64.0% | -56.2% | -45.5% | -37.2% | -28.1% |
| Countries: | Jan-09 | Dec-08 | Nov-08 | 3-Mo | 3-Mo | 6-mo | 6-mo | 12-mo | 12-mo |
| Germany (MFG): | -7.6% | -8.1% | -7.5% | -61.9% | -61.3% | -52.5% | -46.3% | -35.0% | -30.3% |
| France (Ind): | -2.5% | -2.0% | -6.6% | -36.6% | -52.1% | -44.6% | -36.5% | -28.0% | -23.3% |
| Italy (Ind): | #N/A | -2.0% | -6.6% | #N/A | -47.2% | #N/A | -31.4% | #N/A | -18.4% |
| UK (Engineering Ind): | -25.2% | 26.1% | -11.9% | -52.3% | -33.0% | -39.7% | 5.0% | -34.4% | 1.7% |

Tom Moeller
AuthorMore in Author Profile »Prior to joining Haver Analytics in 2000, Mr. Moeller worked as the Economist at Chancellor Capital Management from 1985 to 1999. There, he developed comprehensive economic forecasts and interpreted economic data for equity and fixed income portfolio managers. Also at Chancellor, Mr. Moeller worked as an equity analyst and was responsible for researching and rating companies in the economically sensitive automobile and housing industries for investment in Chancellor’s equity portfolio. Prior to joining Chancellor, Mr. Moeller was an Economist at Citibank from 1979 to 1984. He also analyzed pricing behavior in the metals industry for the Council on Wage and Price Stability in Washington, D.C. In 1999, Mr. Moeller received the award for most accurate forecast from the Forecasters' Club of New York. From 1990 to 1992 he was President of the New York Association for Business Economists. Mr. Moeller earned an M.B.A. in Finance from Fordham University, where he graduated in 1987. He holds a Bachelor of Arts in Economics from George Washington University.
More Economy in Brief


