 Global| Sep 29 2006
U.S. Personal Income Up As Expected, Core Price Inflation Tame
by:Tom Moeller
|in:Economy in Brief
Summary
Personal income matched expectations and rose 0.3% last month after a downwardly revised 0.5% gain during July. Personal consumption rose a slightly less than expected 0.1%, held back held back by a 6.5% m/m drop (-4.7% y/y) in unit [...]
Personal consumption rose a slightly less than expected 0.1%, held back held back by a 6.5% m/m drop (-4.7% y/y) in unit vehicle sales. So far in 3Q real spending is up at a 2.7% annual rate versus last quarter, slightly better than the 2Q rate of gain.
The PCE chain price index rose an expected 0.2%, less than the 0.3% gain during the prior month. Less food & energy prices also rose an expected 0.2% (2.5% y/y), the same as this year's monthly average and the same as the monthly average increase during 2005.
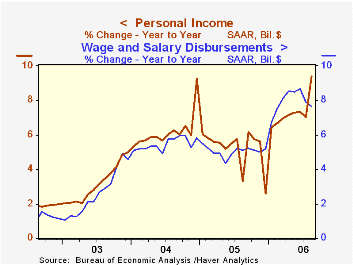
Wage & salary disbursements ticked up 0.1% (7.7% y/y) following two months of 0.6% increase. Wages in the private service-producing industries were unchanged (8.5% y/y) and the average monthly increase this year has been 0.8%, double last year's monthly average. Factory sector wages fell 0.1% (+6.5% y/y) and the average monthly increase this year has been 0.8% versus a 0.2% average during 2005.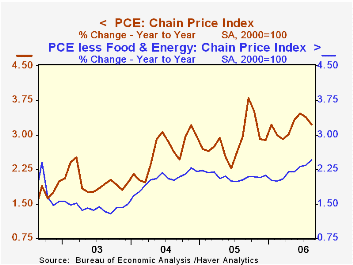
Interest income fell by 0.2% (+8.4% y/y) for the second consecutive month but dividend income surged for the third month by 1.0% (11.4% y/y).
Disposable personal income increased 0.4% (8.8% y/y). Personal taxes fell slightly (+14.0% y/y).
Adjusted for price inflation, disposable personal income increased 0.3% (5.3% y/y), up slightly from this year's 0.2% average and up from the 0.1% average monthly decline last year. Real disposable income per capita rose 0.1% (4.4% y/y).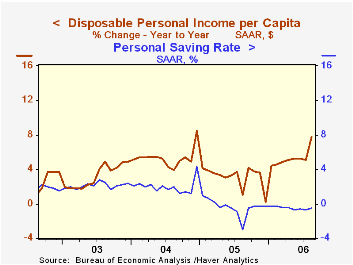
The personal savings rate was a slightly less negative -0.5% last month and so far in 2006 has averaged -0.5%, the same as last year. Should the Decline in the Personal Saving Rate Be a Cause for Concern? from the Federal Reserve Bank of Kansas City is available here.
Borrowing by U.S. Households from the Federal Reserve Bank of Richmond can be found here.
Middle Class in Turmoil: Economic Risks Up Sharply for Most Families Since 2001 from the Center for American Progress is available here.
| Disposition of Personal Income | August | July | Y/Y | 2005 | 2004 | 2003 |
|---|---|---|---|---|---|---|
| Personal Income | 0.3% | 0.5% | 9.4% | 5.2% | 6.2% | 3.2% |
| Personal Consumption | 0.1% | 0.8% | 5.0% | 6.5% | 6.6% | 4.8% |
| Savings Rate | -0.5% | -0.7% | -3.0% (Aug. '05) | -0.4% | 2.0% | 2.1% |
| PCE Chain Price Index | 0.2% | 0.3% | 3.2% | 2.9% | 2.6% | 2.0% |
| Less food & energy | 0.2% | 0.1% | 2.5% | 2.1% | 2.0% | 1.4% |
by Tom Moeller September 29, 2006
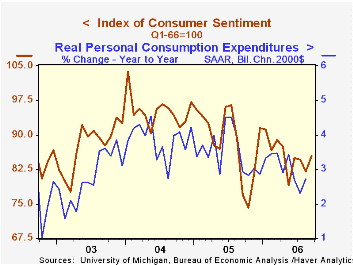
Consumer sentiment for all of September improved, according to the University of Michigan. The full month reading recouped all an August decline and rose 4.1% to 85.4, up from a mid-month read of 84.4. Consensus expectations had been for an increase to 85.2.
During the last ten years there has been a 77% correlation between the level of consumer sentiment and the y/y change in real consumer spending and during those ten years sentiment has a 68% correlation with the change in nonfarm payrolls.
Expected inflation during the next year fell sharply to 3.6% from 4.6%, its lowest level since February. The full month figure was unchanged from the preliminary read. The five to ten year expected rate of inflation also fell to 3.2%, reversing all of the rise during August.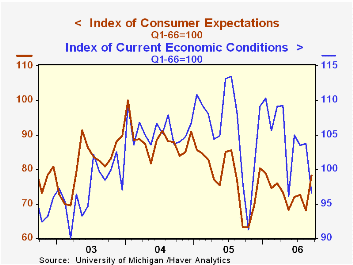
Expectations for the economy surged 15.0% m/m to the highest level since January. Expected business conditions next year rose by nearly one third and over the next five years they improved sharply for the third month. The expected change in personal finances also firmed quite a bit and reversed all of the prior month's steep decline.
The reading of current economic conditions fell sharply m/m but did improve late in the month so that the figure was the lowest since June. The current read of personal finances fell for the third consecutive month (-3.9% y/y) and perceived buying conditions for large household goods fell sharply (0.0% y/y).
Consumers' opinion about gov't economic policy was unchanged for the third month (0.0% y/y).
The University of Michigan survey is not seasonally adjusted.The mid-month survey is based on telephone interviews with 250 households nationwide on personal finances and business and buying conditions. The survey is expanded to a total of 500 interviews at month end.Making the Systematic Part of Monetary Policy Transparent from the Federal Reserve Bank of Richmond is available here.
| University of Michigan | September | August | Y/Y | 2005 | 2004 | 2003 |
|---|---|---|---|---|---|---|
| Consumer Sentiment | 85.4 | 82.0 | 11.1% | 88.6 | 95.2 | 87.6 |
| Current Conditions | 96.6 | 103.8 | -1.5% | 105.9 | 105.6 | 97.2 |
| Expectations | 78.2 | 68.0 | 23.5% | 77.4 | 88.5 | 81.4 |
by Carol Stone September 29, 2006
Some weeks ago, Japan released its updated and rebased CPI. This week, New Zealand has done so. Consumers buy new products at new outlets. The compilation of inflation measures has to keep up with these spending changes. New Zealand last reweighted its CPI in 2002 and it last reselected its sample of retail outlets in 1999. This new formulation does both of these and adds some new techniques for monitoring spending behavior. In total, the inflation pattern is little altered by these changes, possibly because the revision process is frequent enough to prevent outmoded products and methods from overstaying their usefulness.
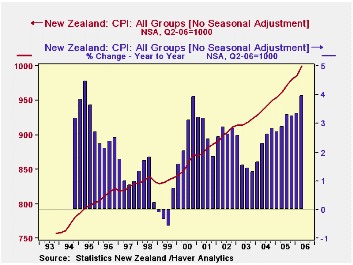
New Zealand's CPI is quarterly. The new index is based at 1000 in the so-called "June quarter". The previous base period was June 1999, and on that base, the June 2006 figure was 1202. The new series, rebased to June 1999, puts the June 2006 number at 1203.4 (easily shown in DLXVG3 using the "advanced functions" feature and choosing "Index" with 19992 as the period and 1000 as the index level). Inflation over the past year has been 4.0% according to both the new and old series.
As with the Japanese revisions, a number of items were removed and new added. The listing provided by Statistics New Zealand shows 20 entirely new items, 13 old ones replaced and 10 deleted. All together, 685 items are priced. Among these changes, new entries include bottled water, nasal sprays, laptop computers and surfboards. Canned soups replaced powdered soup mixes and MP3 players replaced portable CD players. DVD players had already been introduced, but player/recorders were added this time. Refrigerators without freezers were dropped, as were hairspray and clothes lines.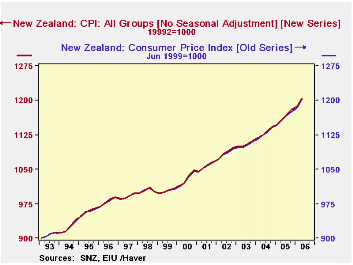
The Statistics New Zealand staff studied population changes and consequently shifted more of its polling to cities, particularly Auckland. They used private market research firms' data on transactions which were obtained from analysis of barcode scanning. This enabled the staff to select more frequently used supermarkets and appliance dealers. They also found that lower priced outlets were taking an increasing share of business.
As readers can tell, we are fascinated by the selection of items in the new New Zealand CPI and also the various methodologies the New Zealanders have applied to revise their consumer price index. This discussion is incomplete in skipping over a change in seasonal adjustment policy and from the use of additive computations to geometric means, along with other actions. All of the techniques are explored in an informative and readable working paper on their website, available here.
| New Zealand, CPI Indexes, NSA | Q2 2006 "June" | Q1 2006 "March" | Q4 2005 "Dec." | Annual Averages|||
|---|---|---|---|---|---|---|
| 2005 | 2004 | 2003 | ||||
| June 2006 = 1000 | 1000 | 986 | 981 | 968 | 939 | 918 |
| Yr/Yr % Chg | 4.0 | 3.4 | 3.3 | 3.0 | 2.3 | 1.7 |
| June 1999 = 1000, Y/Y % Chg | 4.0 | 3.3 | 3.2 | 3.0 | 2.3 | 1.7 |

Tom Moeller
AuthorMore in Author Profile »Prior to joining Haver Analytics in 2000, Mr. Moeller worked as the Economist at Chancellor Capital Management from 1985 to 1999. There, he developed comprehensive economic forecasts and interpreted economic data for equity and fixed income portfolio managers. Also at Chancellor, Mr. Moeller worked as an equity analyst and was responsible for researching and rating companies in the economically sensitive automobile and housing industries for investment in Chancellor’s equity portfolio. Prior to joining Chancellor, Mr. Moeller was an Economist at Citibank from 1979 to 1984. He also analyzed pricing behavior in the metals industry for the Council on Wage and Price Stability in Washington, D.C. In 1999, Mr. Moeller received the award for most accurate forecast from the Forecasters' Club of New York. From 1990 to 1992 he was President of the New York Association for Business Economists. Mr. Moeller earned an M.B.A. in Finance from Fordham University, where he graduated in 1987. He holds a Bachelor of Arts in Economics from George Washington University.
More Economy in Brief


