 Global| Feb 01 2010
U.S. Personal Income &Spending In Record Decline Last Year
by:Tom Moeller
|in:Economy in Brief
Summary
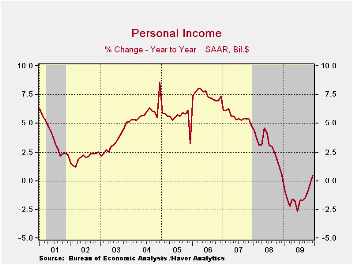
The Commerce Department's latest report on consumer income & spending indicated that times were never worse than in 2009. Cutbacks in employment prompted a record 1.4% annual decline (it's never before fallen y/y), though modest [...]
 The
Commerce
Department's latest report on consumer income & spending
indicated that times were never worse than in 2009. Cutbacks in
employment prompted a record 1.4% annual decline (it's never before
fallen y/y), though modest positive growth returned in the second half.
Indeed, income rose during December about as it did beginning in the
spring due to easing declines in employment, faster growth in dividend
income and rising transfer payments.
The
Commerce
Department's latest report on consumer income & spending
indicated that times were never worse than in 2009. Cutbacks in
employment prompted a record 1.4% annual decline (it's never before
fallen y/y), though modest positive growth returned in the second half.
Indeed, income rose during December about as it did beginning in the
spring due to easing declines in employment, faster growth in dividend
income and rising transfer payments.
Overall personal income gained 0.4% during December after an upwardly revised 0.5% November increase. The latest figure outpaced Consensus expectations for a 0.3% rise. Wages & salaries ticked up 0.1% after an upwardly revised 0.4% November increase but for the year wage income fell by 3.3% due to fewer jobs and pay cuts. Wages in the factory sector fell 0.3% and were down a hard 10.3% for the year. That decline followed a 1.5% drop during 2008. In the service sector wages rose a firmer 0.3% but were down an unprecedented 2.9% for the year. A 0.3% December rise in wages in the government sector and a 3.6% gain for the full year offset a negligible portion of these private sector declines.
Disposable income rose a steady 0.4% during December and for the year rose 1.5% due to tax cuts early in the year. These cuts enabled the savings rate to rise to 4.8% which was near where it began the year but up sharply from the 1.0% low at the beginning of 2008.
Due to the pickup in corporate profitability in the second half of last year monthly dividend income began to grow. However, earlier declines which extended back to 2007 pulled the full-year figure down 19.2%. Offsetting some of the annual decline were unemployment insurance payments which more than doubled for the year as a whole. However, that growth turned negative by yearend as long-term unemployment exhausted benefit claims.
Personal spending ticked up just 0.2% in December after an upwardly revised 0.7% November increase. For the year spending fell an unprecedented 0.4%. Adjusted for inflation the yearly decline mounted to 0.6% which was the second year of negative growth. Pulling down the yearly figures were 8.8% and 13.6% declines in real spending on motor vehicles. Adding to that were 6.0% and 2.9% drops in furniture & household durables as well as less spending on clothing. Spending on services was roughly unchanged as spending on recreation fell 1.3% while fewer meals out & fewer vacations lowered spending here by 2.9%. These declines were unprecedented.
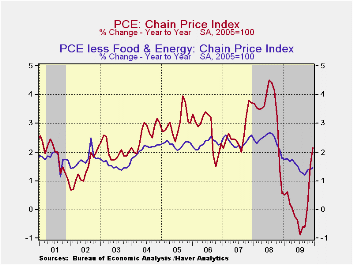
The PCE chain price index ticked up just 0.1% during December and 0.2% for the year pulled down by the fourth year of decline in prices for furnishings & household durables. Higher gasoline prices through much of the year failed to offset declines late in 2008 so for 2009 prices fell roughly one-quarter from 2008. The core PCE price deflator ticked up just 0.1% during December and the 0.2% gain for the year was a record low.
The personal income & consumption figures are available in Haver's USECON and USNA databases.

| Disposition of Personal Income (%) | December | November | October | Y/Y | 2009 | 2008 | 2007 |
|---|---|---|---|---|---|---|---|
| Personal Income | 0.4 | 0.5 | 0.3 | 0.5 | -1.4 | 2.9 | 5.6 |
| Disposable Personal Income | 0.4 | 0.5 | 0.4 | 3.7 | 1.5 | 3.9 | 4.9 |
| Personal Consumption Expenditures | 0.2 | 0.7 | 0.6 | 4.0 | -0.4 | 3.1 | 5.4 |
| Saving Rate | 4.8 | 4.5 | 4.6 | 4.7 (Dec.'08) | 4.6 | 2.6 | 1.7 |
| PCE Chain Price Index | 0.1 | 0.3 | 0.3 | 2.1 | 0.2 | 3.3 | 2.7 |
| Less food & energy | 0.1 | 0.0 | 0.2 | 1.5 | 1.5 | 2.4 | 2.4 |
by Tom Moeller February 1, 2010
 The
pace of
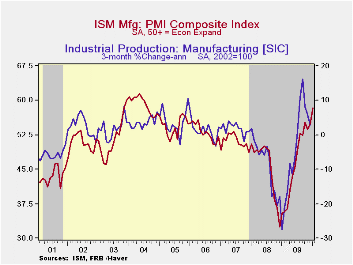
improvement in the U.S. factory sector picked up steam in the new year.
The National Association of Purchasing Management reported that its
January composite index showed unexpected strength, for the second
consecutive month, rising to 58.4 from 54.9 during December. The latest
figure was the highest since August 2004 and was up from the low of
32.9 reached in December '08. The latest jump exceeded Consensus
expectations for a reading of 55.2. (Any figure above the break-even
point of 50 suggests rising activity.) Last year's figures were revised
due to updated seasonal factors and the ISM data is available in
Haver's USECON database.
The
pace of
improvement in the U.S. factory sector picked up steam in the new year.
The National Association of Purchasing Management reported that its
January composite index showed unexpected strength, for the second
consecutive month, rising to 58.4 from 54.9 during December. The latest
figure was the highest since August 2004 and was up from the low of
32.9 reached in December '08. The latest jump exceeded Consensus
expectations for a reading of 55.2. (Any figure above the break-even
point of 50 suggests rising activity.) Last year's figures were revised
due to updated seasonal factors and the ISM data is available in
Haver's USECON database.
The latest ISM level is consistent with roughly 4.0% growth in factory sector output. This positive growth rate resembles recoveries from past severe recessions but to fully mirror the strength of those recoveries the index needs to rise to a level near or above 60.
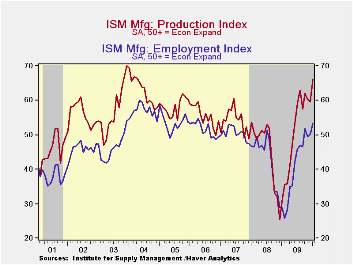
The production component posted the strongest m/m gain last month but remained lower than its 2004 high. During the last ten years there has been an 84% correlation between the level of the production component of the composite index and the three-month growth in factory sector industrial production. It is appropriate to correlate the ISM index level with factory sector output growth because the ISM index is a diffusion index. It measures growth by using all of the positive changes in activity added to one half of the zero change in activity measures.
The employment index also posted a strong increase to 53.3 which indicated positive growth in factory sector payrolls for three out of the last four months. It's up from a low reading of 25.9 last February. Fifteen percent of respondents indicated higher payrolls versus only five percent last January. Twelve percent indicated a lower level of hiring versus 49% last January. During the last ten years there has been a 90% correlation between the index level and the three-month change in manufacturing payrolls.
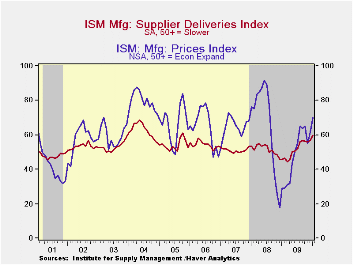
The rise in the inventory component to 46.5 brought it back near the October high. Sixteen percent (NSA) of respondents indicated that they were raising inventory levels versus 18% last January. During the strong 2005 inventory accumulation 26% of firms indicated that they were raising inventories. Twenty-four percent of respondents indicated lower inventories last month. The vendor performance indicator which measures the speed of deliveries rose to 60.1. This indication of slower speeds was its highest since 2005.
The new orders index showed a lesser m/m increase, but it reached a new high of 65.9. The export order index also rose to a new high and was up from its low of 35.5 in December '08. During the last ten years there has been a 53% correlation between the index and the q/q change in real exports of goods in the GDP accounts.
The separate index of prices paid also rose to a new cycle-high of 70.0. That was up from the December '08 low of 18.0. During the last twenty years there has been a 79% correlation between the price index and the three-month change in the PPI for intermediate goods. Forty-four percent of respondents reported higher prices while only 4 percent indicated lower prices.
The ISM data are available in Haver's USECON database.
Focusing on Bank Interest Rate Risk Exposure is Friday's speech by Fed Vice Chairman Donald L. Kohn and it is available here.
| ISM Mfg | January | December | November | Jan. '09 | 2009 | 2008 | 2007 |
|---|---|---|---|---|---|---|---|
| Composite Index | 58.4 | 54.9 | 53.7 | 35.5 | 46.2 | 45.5 | 51.1 |
| New Orders | 65.9 | 64.8 | 61.5 | 33.2 | 51.6 | 42.1 | 54.3 |
| Employment | 53.3 | 50.2 | 49.6 | 29.0 | 40.5 | 43.3 | 50.5 |
| Production | 66.2 | 59.7 | 60.2 | 30.8 | 50.4 | 45.2 | 54.1 |
| Supplier Deliveries | 60.1 | 56.8 | 55.7 | 45.9 | 51.4 | 51.6 | 51.2 |
| Inventories | 46.5 | 43.0 | 41.4 | 38.4 | 37.1 | 45.5 | 45.4 |
| Prices Paid Index (NSA) | 70.0 | 61.5 | 55.0 | 29.0 | 48.3 | 66.5 | 64.6 |
by Tom Moeller February 1, 2010
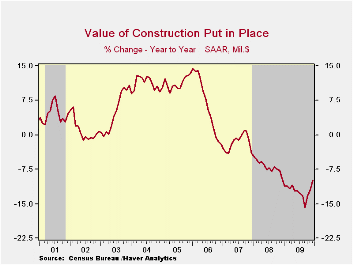 Construction
activity moved lower, again. During December construction outlays fell
1.2% after a 1.2% November shortfall that was double the initial
estimate. The latest decline was double the Consensus estimate. The
worst of the news, however, was that for the full year the 12.2%
shortfall in activity was nearly double the 2008 rate of decline and
the third consecutive yearly drop.
Construction
activity moved lower, again. During December construction outlays fell
1.2% after a 1.2% November shortfall that was double the initial
estimate. The latest decline was double the Consensus estimate. The
worst of the news, however, was that for the full year the 12.2%
shortfall in activity was nearly double the 2008 rate of decline and
the third consecutive yearly drop.
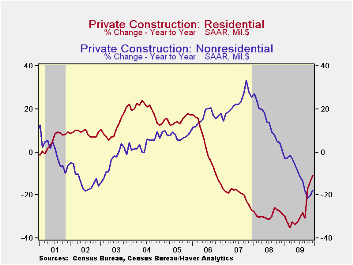
The December decline in residential building activity matched its November rate and pulled spending down again by nearly one-third y/y. Moreover, the latest level was nearly two-thirds below the 2006 high. Single-family construction activity has shown positive growth for the last seven months; however, the monthly gains have been steadily receding and overall activity was down one-half for the year. That was fourth consecutive year of lower residential building activity and it's off three-quarters from the 2006 peak. Multi-family construction activity fell nearly one-third for the year and it is off nearly two-thirds from the 2007 peak. The source of relative strength came from residential improvements which fell just 2.2% for 2009 and was off just one-quarter from the 2007 peak.
Nonresidential building activity fell another 1.8% during December and was off 11.2% for the year. Since the 2008 peak, activity has fallen by 26.9%. Spending in the food & beverage industry fell by one-third for the year. Expenditures in the lodging industry were off a similar amount. Commercial building overall fell by two-thirds y/y while office building dropped similarly. Relatively moderate were the declines in the education (-9.8% y/y), religious (-10.6% y/y) and health care (-5.1% y/y) sectors.
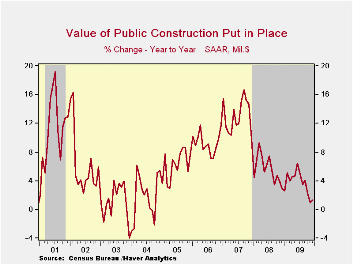
In the public sector, construction rose 3.7% for the year, despite lower tax revenues. Building activity on highways & streets rose 3.3% for the year as the focus on infrastructure rebuilding grew. Public spending on health care facilities increased a strong 14.7% y/y but building in the education sector rose just 1.5% for the full year.
The construction put-in-place figures are available in Haver's USECON database.
| Construction (%) | December | November | October | Y/Y | 2009 | 2008 | 2007 |
|---|---|---|---|---|---|---|---|
| Total | -1.2 | -1.2 | 1.5 | -9.9 | -12.2 | -6.9 | -1.6 |
| Private | -1.2 | -1.1 | 4.7 | -14.9 | -18.5 | -11.1 | -5.7 |
| Residential | -2.8 | -1.4 | 11.8 | -10.9 | -27.8 | -29.1 | -19.7 |
| Nonresidential | 0.2 | -0.9 | -3.6 | -17.7 | -10.6 | 13.2 | 23.1 |
| Public | -1.2 | -1.2 | -0.9 | 1.3 | 3.7 | 5.6 | 13.1 |
by Robert Brusca February 1, 2010
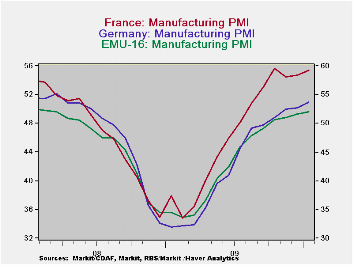
Euro-Area recovery continues - The EU/EMU nation PMIs continue to show recovery. Greece, with its economic difficulties and huge fiscal problems, already is showing signs of an uphill battle. Greece’s MFG PMIs are lower over three months and over six months, only Spain, another Mediterranean country with recovery issues, is in the same boat with MFG PMIs lower over both 3- and 6-mnths. Spain however did mange a PMI increase for the month of January.
Tensions tear at the Euro-Area - The EMU MFG PMI is up for six month in a row. But signs of differences among EMU member countries are beginning to show and coupled with some very specific country-level problems questions about commitment to the zone are starting to arise – right or wrong. Greece has huge budget problems and Spain‘s construction-based ills are going to be a structural impediment to growth for some time to come.
Europe’s differences become a liability - Still, the EMU recovery is looking more and more durable… even if not strong. That some members are having trouble is not surprising. Not even a true single country is uniform in the way a downturn impacts its various industries or regions. Europe is known for its regional differences and differences in efficiencies. For that reason it did not meld its finances together when the EMU region was formed. Each member wanted to maintain its own fiscal independence while some wanted to be shielded from the practices of others. Yet some constraint was needed to keep the union members fiscally close enough for a currency union to work. EMU adopted rules for budget responsibility to constrain the budget gaps across nations. It was hoped that the rules (Maastricht criteria) would succeed in keeping finances on a reasonably similar footing so that fiscal imbalances would not tear the union apart.
Recession as Economic Cat-scan - In any event this severe recession has come suddenly and exposed creeping or hidden imbalances and revealed sharp fiscal differences. Greek government bonds are now some 400 bp in yield above those in Germany and this is for government bonds in the same union with no foreign exchange risk – except for those who think the union could be split by this sort of pressure.
The missing link in Europe - besides lacking true fiscal limitations that work – is the lack of mechanism to close regional competitiveness gaps. Sharp regional differences have endured and broadened. Without the ability to depreciate exchange rates within the region it is hard for a nation to regain when its competitiveness slips. While the growing budget gaps are a public issue the growing competiveness gaps are a bigger problem and one that is harder to solve. Cutting nominal wages or boosting productivity are both hard to do it. Yet both are easier said than done. Closing a fiscal imbalance by hiking taxes or cutting spending is comparatively much easier – simple to do in fact although hard to find the will.
Recovery in train but not strong enough to bail out Greece - The recovery is still ongoing and that is good news since growth can cure all ills if the growth is fast enough. But the recovery in MFG is already slowing. The EMU MFG index has risen by 6.14 points over six months and by only 1.66 points over the last three months. Italy’s MFG sector is showing the best maintained ‘pace of recovery’ as it is up 6.39 point over six months and 2.51 points over three months indicating only a slight slowing in the pace of improvement. Other are growing faster over six months (France and Germany) but Italy is maintaining its pace of expansion best.
Euro laggards - Spain and Greece are down the most from their past cycle peaks; among the countries presented in the table each is down by some 12 points compared to an 8 point shortfall for EMU as a whole. Contrast this to the UK which has its MFG index back at its peak. Greece is also up by only 8 points from its cycle low point, the feeblest recovery of this group. Germany for example is up 21 points from its cycle low.
Questions for the Euro-Area - On balance Europe has some issues that are now starting to dog the euro. The dollar has regained some luster even though the US fiscal situation is not exactly rosy. No one is quite sure how deep Europe’s rift will run and what the Europeans will have to do to solve their problems. When push came to shove Iceland got bailed out and now Iceland is reluctant to undertake actions to pay back those that bailed it out. Will the Union come to Greece’s aid or will Greece be forces into an independent severe adjustment? In the end the Zone looks a lot like the global banking sector operating with a fatal flaw it thought it could circumvent with a simple rule as a fix. Is the Zone really like a bank with off balance sheet obligations that are about to be brought back on board or will Greece be left to deal with its issues alone?
The Really BIG risk - If the burden left squarely on Greece’s shoulders, does that mean that Greece would try to opt out of the Union? If that happened how would speculation spread to others? No one is quite sure and since the euro-recovery does not seem to be strong enough to save Greece on its own all these are live issues to one extent or another. Thinking about one country exiting the Zone naturally will bring pressures on some others. It is unclear if that means Europe will pitch in to help Greece and set an undesirable precedent or not. Germany already has made great sacrifice to pull the former E Germany into its economic orbit. Would Germans be willing to do more to assist Greece after the Zone was formed with a cushion to try and prevent that sort of thing from happening? These are exactly the sorts of unexpected issues that financial crises put on the table. The UK’s decision to remain part of EU but to not join EMU is looking more and more prescient. Stay tuned.
| Changes in Markit MFG Indices | ||||||||
|---|---|---|---|---|---|---|---|---|
| Changes Mo/Mo | Change on Frequency | |||||||
| Jan-10 | Dec-09 | Nov-09 | 3Mo | 6Mo | 12Mo | From Peak | From Low | |
| Euro-13 | 0.80 | 0.39 | 0.47 | 1.66 | 6.14 | 17.97 | -8.1 | 18.8 |
| Germany | 1.02 | 0.25 | 1.40 | 2.67 | 8.08 | 21.75 | -7.2 | 21.8 |
| France | 0.73 | 0.31 | -1.21 | -0.17 | 7.31 | 17.54 | -9.4 | 20.6 |
| Italy | 0.95 | 0.71 | 0.85 | 2.51 | 6.39 | 15.69 | -8.2 | 17.2 |
| Spain | 0.08 | -0.09 | -1.02 | -1.03 | -2.06 | 13.76 | -12.2 | 16.8 |
| Austria | 1.03 | 0.88 | -1.12 | 0.79 | 5.38 | 18.72 | -7.0 | 18.7 |
| Greece | -1.98 | 1.54 | -0.72 | -1.16 | -2.01 | 6.83 | -12.6 | 8.6 |
| Ireland | -0.72 | 0.02 | 0.78 | 0.08 | 4.43 | 9.15 | -8.3 | 14.9 |
| EU | ||||||||
| UK | 2.05 | 2.32 | -0.73 | 3.64 | 6.20 | 20.06 | 0.0 | 21.8 |
| percentile is over range since March 2000 | ||||||||
by Louise Curley February 1, 2010
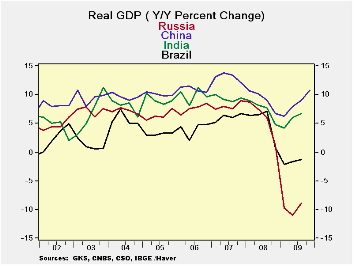 Russia
announced today that real GDP declined 7.9% in 2009, somewhat less than
the 8.5% the government had estimated earlier, but still the deepest
decline among the BRIC countries--Brazil, Russia, India and China as
can be seen in the first chart.
Russia
announced today that real GDP declined 7.9% in 2009, somewhat less than
the 8.5% the government had estimated earlier, but still the deepest
decline among the BRIC countries--Brazil, Russia, India and China as
can be seen in the first chart.
Russia's dependence on oil
was largely responsible for its poor performance. As shown in
the second chart, the price of Urals crude oil fell almost 75% from its
peak of $140.80 a barrel in July 2008 to $35.56 at year
end. By now the price of oil, at $73 a barrel, has
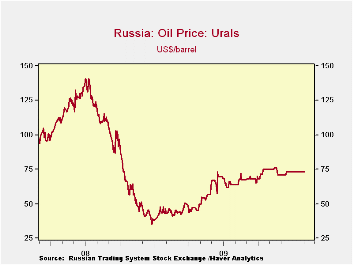 more
than doubled the low point. The annual decline of 7.9%
in GDP implies a significant improvement in the fourth quarter year to
year decline. While there may be revisions in the earlier
data when the actual fourth quarter result is released, an estimate of
the fourth quarter can be derived by subtracting the unseasonally
adjusted published quarterly data for the first three quarters from the
annual total. The implied figure for the fourth quarter, not
shown on the chart, but shown in the table below, is 2.6% below the
year ago figure, a significant improvement over the declines of 9-10%
in the first three quarters.
more
than doubled the low point. The annual decline of 7.9%
in GDP implies a significant improvement in the fourth quarter year to
year decline. While there may be revisions in the earlier
data when the actual fourth quarter result is released, an estimate of
the fourth quarter can be derived by subtracting the unseasonally
adjusted published quarterly data for the first three quarters from the
annual total. The implied figure for the fourth quarter, not
shown on the chart, but shown in the table below, is 2.6% below the
year ago figure, a significant improvement over the declines of 9-10%
in the first three quarters.
| Q4 09 | Q3 09 | Q2 09 | Q1 09 | 2009 | 2008 | 2007 | 2006 | |
|---|---|---|---|---|---|---|---|---|
| GDP (Billions, Chained 2003 Rubles) | 4756.2* | 4570.6 | 4014.6 | 3736.3 | 17077.7 | 18552.5 | 17570.9 | 16255.5 |
| Y/Y Pct Change | -2.6* | -8.9 | -10.9 | -9.8 | 7.9 | 5.6 | 8.1 | 7.7 |
| * Computed: Reported annual total minus reported quarterly totals for first three quarters. | ||||||||

Tom Moeller
AuthorMore in Author Profile »Prior to joining Haver Analytics in 2000, Mr. Moeller worked as the Economist at Chancellor Capital Management from 1985 to 1999. There, he developed comprehensive economic forecasts and interpreted economic data for equity and fixed income portfolio managers. Also at Chancellor, Mr. Moeller worked as an equity analyst and was responsible for researching and rating companies in the economically sensitive automobile and housing industries for investment in Chancellor’s equity portfolio. Prior to joining Chancellor, Mr. Moeller was an Economist at Citibank from 1979 to 1984. He also analyzed pricing behavior in the metals industry for the Council on Wage and Price Stability in Washington, D.C. In 1999, Mr. Moeller received the award for most accurate forecast from the Forecasters' Club of New York. From 1990 to 1992 he was President of the New York Association for Business Economists. Mr. Moeller earned an M.B.A. in Finance from Fordham University, where he graduated in 1987. He holds a Bachelor of Arts in Economics from George Washington University.
More Economy in Brief


