 Global| Mar 01 2006
U.S. Personal Income & Spending Firm Again
by:Tom Moeller
|in:Economy in Brief
Summary
The 0.7% rise in personal income was slightly stronger than Consensus expectations for a 0.6% advance during January and followed an upwardly revised 0.5% increase in December. Wage & salary disbursements nearly doubled the prior [...]
The 0.7% rise in personal income was slightly stronger than Consensus expectations for a 0.6% advance during January and followed an upwardly revised 0.5% increase in December.
Wage & salary disbursements nearly doubled the prior month's pace and rose 0.7% (5.1% y/y). The December rise was upwardly revised to 0.4%. Factory sector wages rose 0.2% (3.0% y/y) and service sector wages jumped 0.8% (5.4% y/y) after the upwardly revised 0.6% December increase.
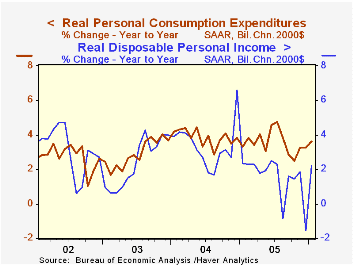
Disposable personal income rose 0.5% (5.4% y/y) for the third month in the last four but adjusted for a stiff 0.5% gain in prices, disposable income eked out only a negligible m/m rise (2.2% y/y).The 0.9% rise in personal consumption expenditures was a bit short of expectations for a 1.0% gain due to a light 0.1% increase in services spending. That gain was restrained by an 8.8% m/m decline (+11.0% y/y) in spending on electricity & gas services due to warm temperatures. Spending on motor vehicles & parts rose 0.5% (1.6% y/y) but spending on furniture & household equipment boomed 1.9% (6.7% y/y). Spending on clothing & shoes also was quite strong and posted a 2.3% advance (6.9% y/y) and spending on food jumped for the second month in the last three, in January by 1.6% (8.9% y/y).
The PCE chain price index was quite firm and rose 0.5%, the first increase after two months of decline. Gasoline & oil prices jumped 6.2% (26.4% y/y) though in February the retail price of gasoline backed off to an average $2.28 per gallon from $2.32 during January. During the latest week gasoline was $2.25 per gallon. Less food & energy, prices increased 0.2% following an unrevised 0.1% December rise. Nondurables prices surged 1.0% due to the rise in gasoline but food prices also rose a firm 0.5% (2.5% y/y). Durables prices rose 0.1% (-1.3% y/y), held back by another decline in furniture & household equipment prices (-4.4% y/y). Clothing & shoes prices rose by -0.1% (-1.3% y/y).
The personal savings rate was negative for the ninth month in the last ten.
Recent Changes in U.S. Family Finances: Evidence from the 2001 and 2004 Survey of Consumer Finances from the Federal Reserve Board is available here.
| Disposition of Personal Income | Jan | Dec | Y/Y | 2005 | 2004 | 2003 |
|---|---|---|---|---|---|---|
| Personal Income | 0.7% | 0.5% | 5.8% | 5.5% | 5.9% | 3.2% |
| Personal Consumption | 0.9% | 0.7% | 6.8% | 6.5% | 6.5% | 4.9% |
| Savings Rate | -0.7% | -0.4% | 0.7% (Jan '05) | -0.4% | 1.7% | 2.1% |
| PCE Chain Price Index | 0.5% | -0.0% | 3.1% | 2.8% | 2.6% | 1.9% |
| Less food & energy | 0.2% | 0.1% | 1.8% | 2.0% | 2.0% | 1.3% |

Tom Moeller
AuthorMore in Author Profile »Prior to joining Haver Analytics in 2000, Mr. Moeller worked as the Economist at Chancellor Capital Management from 1985 to 1999. There, he developed comprehensive economic forecasts and interpreted economic data for equity and fixed income portfolio managers. Also at Chancellor, Mr. Moeller worked as an equity analyst and was responsible for researching and rating companies in the economically sensitive automobile and housing industries for investment in Chancellor’s equity portfolio. Prior to joining Chancellor, Mr. Moeller was an Economist at Citibank from 1979 to 1984. He also analyzed pricing behavior in the metals industry for the Council on Wage and Price Stability in Washington, D.C. In 1999, Mr. Moeller received the award for most accurate forecast from the Forecasters' Club of New York. From 1990 to 1992 he was President of the New York Association for Business Economists. Mr. Moeller earned an M.B.A. in Finance from Fordham University, where he graduated in 1987. He holds a Bachelor of Arts in Economics from George Washington University.
More Economy in Brief


