 Global| Mar 01 2006
U.S. Personal Income & Spending Firm Again
by:Tom Moeller
|in:Economy in Brief
Summary
The 0.7% rise in personal income was slightly stronger than Consensus expectations for a 0.6% advance during January and followed an upwardly revised 0.5% increase in December. Wage & salary disbursements nearly doubled the prior [...]
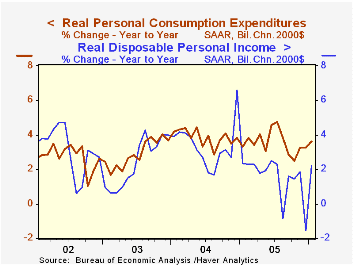
The 0.7% rise in personal income was slightly stronger than Consensus expectations for a 0.6% advance during January and followed an upwardly revised 0.5% increase in December.
Wage & salary disbursements nearly doubled the prior month's pace and rose 0.7% (5.1% y/y). The December rise was upwardly revised to 0.4%. Factory sector wages rose 0.2% (3.0% y/y) and service sector wages jumped 0.8% (5.4% y/y) after the upwardly revised 0.6% December increase.
Disposable personal income rose 0.5% (5.4% y/y) for the third month in the last four but adjusted for a stiff 0.5% gain in prices, disposable income eked out only a negligible m/m rise (2.2% y/y).The 0.9% rise in personal consumption expenditures was a bit short of expectations for a 1.0% gain due to a light 0.1% increase in services spending. That gain was restrained by an 8.8% m/m decline (+11.0% y/y) in spending on electricity & gas services due to warm temperatures. Spending on motor vehicles & parts rose 0.5% (1.6% y/y) but spending on furniture & household equipment boomed 1.9% (6.7% y/y). Spending on clothing & shoes also was quite strong and posted a 2.3% advance (6.9% y/y) and spending on food jumped for the second month in the last three, in January by 1.6% (8.9% y/y).
The PCE chain price index was quite firm and rose 0.5%, the first increase after two months of decline. Gasoline & oil prices jumped 6.2% (26.4% y/y) though in February the retail price of gasoline backed off to an average $2.28 per gallon from $2.32 during January. During the latest week gasoline was $2.25 per gallon. Less food & energy, prices increased 0.2% following an unrevised 0.1% December rise. Nondurables prices surged 1.0% due to the rise in gasoline but food prices also rose a firm 0.5% (2.5% y/y). Durables prices rose 0.1% (-1.3% y/y), held back by another decline in furniture & household equipment prices (-4.4% y/y). Clothing & shoes prices rose by -0.1% (-1.3% y/y).
The personal savings rate was negative for the ninth month in the last ten.
Recent Changes in U.S. Family Finances: Evidence from the 2001 and 2004 Survey of Consumer Finances from the Federal Reserve Board is available here.
| Disposition of Personal Income | Jan | Dec | Y/Y | 2005 | 2004 | 2003 |
|---|---|---|---|---|---|---|
| Personal Income | 0.7% | 0.5% | 5.8% | 5.5% | 5.9% | 3.2% |
| Personal Consumption | 0.9% | 0.7% | 6.8% | 6.5% | 6.5% | 4.9% |
| Savings Rate | -0.7% | -0.4% | 0.7% (Jan '05) | -0.4% | 1.7% | 2.1% |
| PCE Chain Price Index | 0.5% | -0.0% | 3.1% | 2.8% | 2.6% | 1.9% |
| Less food & energy | 0.2% | 0.1% | 1.8% | 2.0% | 2.0% | 1.3% |
by Tom Moeller March 1, 2006
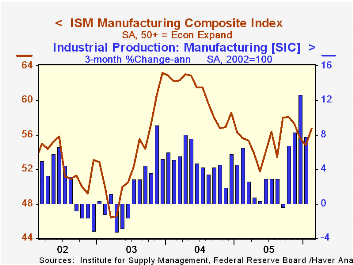
The Institute of Supply Management (ISM) reported that the February Composite Index of activity in the manufacturing sector recovered 1.9 points to 56.7, the first m/m increase since October. Consensus expectations had been for a lesser increase to 55.2.
During the last twenty years there has been a 68% correlation between the level of the Composite Index and the three month growth in factory sector industrial production.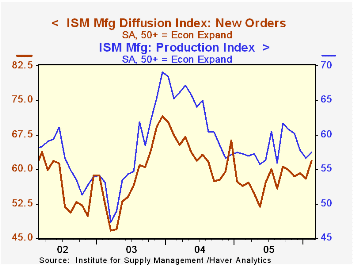
Each of the index's five components rose last month except vendor deliveries which, at 52.2, is off sharply from the 2004 high of 68.5. The new orders index rose to the highest level (61.9) in more than a year and the employment index recovered to the highest level (55.0) since November. During the last twenty years there has been a 67% correlation between the level of the ISM employment Index and the three month growth in factory sector employment.
Production recovered most of the drop in January but it was only the first increase in the last five months and the inventory index rose sharply to nearly a one year high.
The price index slipped 2.5 points to its lowest level since last summer. During the last twenty years there has been a 77% correlation between the price index and the three month change in the PPI for intermediate goods.
| ISM Manufacturing Survey | Feb | Jan | Feb '05 | 2005 | 2004 | 2003 |
|---|---|---|---|---|---|---|
| Composite Index | 56.7 | 54.8 | 55.6 | 55.5 | 60.5 | 53.3 |
| New Orders Index | 61.9 | 58.0 | 56.4 | 57.4 | 63.5 | 57.9 |
| Prices Paid Index (NSA) | 62.5 | 65.0 | 65.5 | 66.4 | 79.8 | 59.6 |
by Tom Moeller March 1, 2006
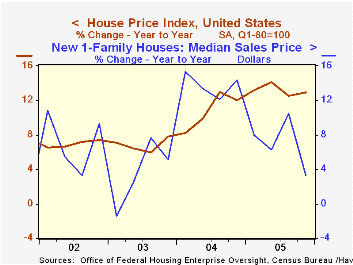
According to the Office of Federal Housing Enterprise Oversight (OFHEO), U.S. home prices rose last quarter at roughly the same rate as during the prior two years. The 2.9% q/q rise certainly was down from the upwardly revised 3.1% gain during the prior quarter and was down from a 4.6% quarterly jump during 3Q04, but the 4Q/4Q gain of 13.0% was near the series' peak. For all of 2005, the 13.2% rate of appreciation set a new record.
The House Price Indices in this report are weighted indexes based on repeat sales or refinancings using data provided by Fannie Mae or Freddie Mac.
Monday's report that median prices for new homes sold last year rose just 7.0%, roughly half the 2004 rate of growth, may suggest that fewer large expensive homes were sold during 2005 than during the prior year.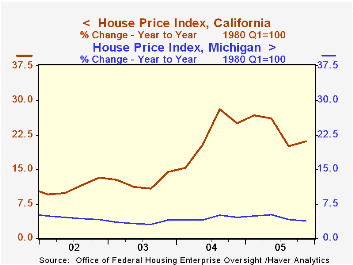
While rates of home price appreciation appear to have topped throughout the country, they have been steady. Moreover, the variance in the rates of growth between regions remained high.
During the last year, job cutbacks in the auto industry helped lower the 4Q/4Q rate of home price appreciation in Michigan to 3.8% and the state's gain has lagged all others. Conversely, California home prices logged a strong 4Q05 gain of 4.6% (21.1% y/y) while demographic trends raised Arizona home prices by 34.9% 4Q/4Q and Florida home prices by 26.8%.
During the last five years, home price appreciation in the District of Columbia surpassed all others at 16.9% per year followed closely by California at 16.2% per annum. Indiana at 3.8%, Nebraska at 4.2% and Michigan at 4.5% are at the bottom of the list. New Jersey (12.7%), New York ((11.5%) and Massachusetts (11.1%) ranked high but just behind Hawaii at 14.6% home price appreciation averaged during the last five years.
The latest report from the Office of Federal Housing Enterprise Oversight (OFHEO) can be found here.
| House Price Index (OFHEO) | 4Q '05 | 3Q '05 | Y/Y | 2005 | 2004 | 2003 |
|---|---|---|---|---|---|---|
| United States | 2.9% | 3.1% | 13.0% | 13.2% | 10.8% | 6.8% |
| California | 4.6% | 4.6% | 21.1% | 23.3% | 22.3% | 12.3% |
| New Jersey | 3.5% | 3.7% | 15.6% | 16.2% | 15.0% | 10.5% |
| Alabama | 2.5% | 2.1% | 9.2% | 7.9% | 4.1% | 4.1% |
| Michigan | 0.7% | 0.9% | 3.8% | 4.5% | 4.4% | 3.4% |
by Tom Moeller March 1, 2006
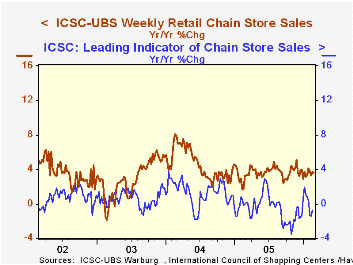
Chain store sales surged 1.5% during the last week of February after a 0.2% up tick the prior week, according to the International Council of Shopping Centers (ICSC)-UBS survey.
Strength early and late in the month lifted the average of February sales 0.8% ahead of the January average which rose 1.0% from December.
The leading indicator of chain store sales rose for the first time in four weeks, but the weak 0.1% left the February average 0.5% below January.The ICSC-UBS retail chain-store sales index is constructed using the same-store sales (stores open for one year) reported by 78 stores of seven retailers: Dayton Hudson, Federated, Kmart, May, J.C. Penney, Sears and Wal-Mart.
| ICSC-UBS (SA, 1977=100) | 02/25/06 | 02/18/06 | Y/Y | 2005 | 2004 | 2003 |
|---|---|---|---|---|---|---|
| Total Weekly Chain Store Sales | 469.0 | 461.9 | 3.6% | 3.6% | 4.7% | 2.9% |
by Tom Moeller March 1, 2006
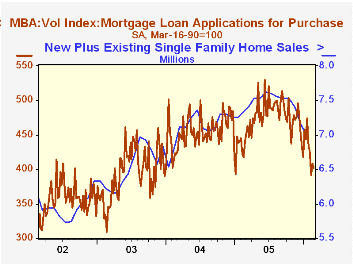
The total number of mortgage applications dropped 1.2% last week, the fourth sharp decline in the last five weeks. The average level of applications during February fell 6.3% from the prior month.
Purchase applications dropped 1.9% from the prior week and the February average fell 10.2% from January. The latest level is down nearly one quarter from the high last Spring.
During the last ten years there has been a 50% correlation between the y/y change in purchase applications and the change in new plus existing single family home sales.
Applications to refinance ticked up 0.1% w/w but the February average fell 2.0% from January.
The effective interest rate on a conventional 30-year mortgage slipped to 6.42% and averaged 6.48% during February versus 6.34% in January. The effective rate on a 15-year mortgage also slipped to 6.15% and averaged 6.16% during February versus 5.98% in January. Interest rates on 15 and 30 year mortgages are closely correlated (>90%) with the rate on 10 year Treasury securities and during the last ten years there has been a (negative) 82% correlation between purchase applications and the effective rate on a 30-Year mortgage.
The Mortgage Bankers Association surveys between 20 to 35 of the top lenders in the U.S. housing industry to derive its refinance, purchase and market indexes. The weekly survey accounts for more than 40% of all applications processed each week by mortgage lenders. Visit the Mortgage Bankers Association site here.
Are Banks Vulnerable to a Housing Bust? from the Federal Reserve Bank of St. Louis is available here.
| MBA Mortgage Applications (3/16/90=100) | 02/24/06 | 02/17/06 | Y/Y | 2005 | 2004 | 2003 |
|---|---|---|---|---|---|---|
| Total Market Index | 571.5 | 578.5 | -19.5% | 708.6 | 735.1 | 1,067.9 |
| Purchase | 400.8 | 408.7 | -8.9% | 470.9 | 454.5 | 395.1 |
| Refinancing | 1,573.5 | 1,571.4 | -31.0% | 2,092.3 | 2,366.8 | 4,981.8 |

Tom Moeller
AuthorMore in Author Profile »Prior to joining Haver Analytics in 2000, Mr. Moeller worked as the Economist at Chancellor Capital Management from 1985 to 1999. There, he developed comprehensive economic forecasts and interpreted economic data for equity and fixed income portfolio managers. Also at Chancellor, Mr. Moeller worked as an equity analyst and was responsible for researching and rating companies in the economically sensitive automobile and housing industries for investment in Chancellor’s equity portfolio. Prior to joining Chancellor, Mr. Moeller was an Economist at Citibank from 1979 to 1984. He also analyzed pricing behavior in the metals industry for the Council on Wage and Price Stability in Washington, D.C. In 1999, Mr. Moeller received the award for most accurate forecast from the Forecasters' Club of New York. From 1990 to 1992 he was President of the New York Association for Business Economists. Mr. Moeller earned an M.B.A. in Finance from Fordham University, where he graduated in 1987. He holds a Bachelor of Arts in Economics from George Washington University.
More Economy in Brief


