 Global| Oct 30 2009
U.S. Personal Income SlipsMarginally And Spending Declines
by:Tom Moeller
|in:Economy in Brief
Summary
The weak job market continued last month to exact its toll on labor income growth. Personal income slipped marginally during September after two months of just 0.1% increase. The August gain was revised down from 0.2% and the latest [...]
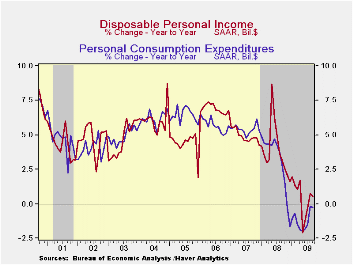 The weak job market continued last month to exact its toll on
labor income growth. Personal income slipped
marginally during September after two months of just 0.1% increase. The
August gain was revised down from 0.2% and the latest figure about
matched Consensus forecasts. These weak increases wholly reflect the
current recession. The good news, however, was that the worst
performance of early this year is over. On a three-month basis income
grew 0.2% during 3Q after a 0.4% 2Q gain. These figures compare to 2.6%
and 0.9% declines during 1Q and 4Q'08, respectively.
The weak job market continued last month to exact its toll on
labor income growth. Personal income slipped
marginally during September after two months of just 0.1% increase. The
August gain was revised down from 0.2% and the latest figure about
matched Consensus forecasts. These weak increases wholly reflect the
current recession. The good news, however, was that the worst
performance of early this year is over. On a three-month basis income
grew 0.2% during 3Q after a 0.4% 2Q gain. These figures compare to 2.6%
and 0.9% declines during 1Q and 4Q'08, respectively.
Job loss continued to account for recent weakness in income growth, but here again the recent numbers are "less bad." Wages & salaries fell 0.2% last month and reversed a 0.2% August increase. Year-to-year wages fell 5.2% after a 2.1% 2008 increase. Downward momentum, however, has eased. During the last three months, wages were roughly unchanged with the lessened rate of job loss reported in the monthly reports on payroll employment. Wages in the factory sector fell 0.2% following the 0.6% August drop. Yet, the three-month change fell to -0.1% from -2.7% and -6.9% during 2Q and 1Q. In the service sector wages slipped 0.1% last month but posted a modest increase during 3Q after declines during the prior three quarters. Offsetting this improvement has been a weaker government sector where wages ticked up just 0.4% during the last three months after 1.1% and 1.6% increases during the prior twp three-month periods.
 Even the growth in unemployment insurance payments slowed
recently. A 2.7% September decline was part of a 3Q slowing to 0.9%
growth from gains between 20%29 and 65% during each of the prior four
quarters. Interest income continued to show the effects of lower rates
and fell for the third straight month while dividend income fell by
one-quarter versus last year as corporate profits evaporated.
Even the growth in unemployment insurance payments slowed
recently. A 2.7% September decline was part of a 3Q slowing to 0.9%
growth from gains between 20%29 and 65% during each of the prior four
quarters. Interest income continued to show the effects of lower rates
and fell for the third straight month while dividend income fell by
one-quarter versus last year as corporate profits evaporated.
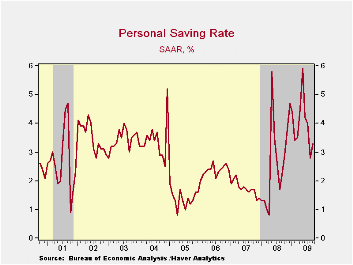
Disposable personal income fell slightly and reversed the August uptick. Adjusted for inflation, real disposable income fell for the fourth straight month after having been lifted this spring by tax cuts. The saving rate increased modestly m/m to 3.3% but remained down from the May peak of 5.9%. The rate remained up slightly from last year and double the 2007 level.
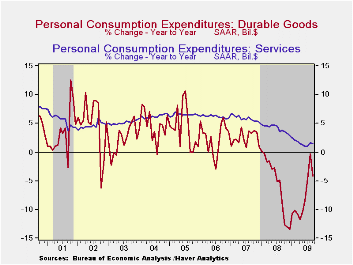
 Personal spending fell 0.5% after having
been lifted during August by the "cash for clunkers" program for new
motor vehicle purchases. Durables spending more-than reversed the
August rise with a 7.0% decline (-4.2% y/y). Spending on motor vehicles
fell 19.5% (-5.9% y/y) and reversed all of the August gain. Spending on
furniture rose a modest 0.4% (-4.7% y/y) and has risen slightly during
the last three months. Spending on nondurables rose 0.7% (-3.7% y/y) as
outlays on apparel rose for the third straight month (-1.7% y/y).
Outlays on services increased 0.2% (1.5% y/y) as spending on health
care continued quite strong and posted a 5.6% gain versus last year.
Spending in restaurants and on recreation remained negative.
Personal spending fell 0.5% after having
been lifted during August by the "cash for clunkers" program for new
motor vehicle purchases. Durables spending more-than reversed the
August rise with a 7.0% decline (-4.2% y/y). Spending on motor vehicles
fell 19.5% (-5.9% y/y) and reversed all of the August gain. Spending on
furniture rose a modest 0.4% (-4.7% y/y) and has risen slightly during
the last three months. Spending on nondurables rose 0.7% (-3.7% y/y) as
outlays on apparel rose for the third straight month (-1.7% y/y).
Outlays on services increased 0.2% (1.5% y/y) as spending on health
care continued quite strong and posted a 5.6% gain versus last year.
Spending in restaurants and on recreation remained negative.
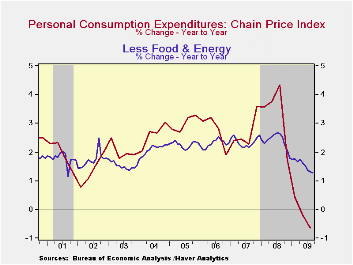
 Prices increased 0.1% during September reflecting an easier
1.2% rise (-29.8% y/y) rise in gasoline costs and another rise is in
store for October. Nevertheless, the PCE chain price index
still was down by 0.5% versus last year. Less food-and-energy, "core"
prices were again soft and posted their fifth consecutive 0.1%
increase. Goods prices rose 0.2% (-1.7% y/y) after two months of
decline while prices for services gained a steady 1.0% y/y.
Prices increased 0.1% during September reflecting an easier
1.2% rise (-29.8% y/y) rise in gasoline costs and another rise is in
store for October. Nevertheless, the PCE chain price index
still was down by 0.5% versus last year. Less food-and-energy, "core"
prices were again soft and posted their fifth consecutive 0.1%
increase. Goods prices rose 0.2% (-1.7% y/y) after two months of
decline while prices for services gained a steady 1.0% y/y.
The personal income & consumption figures are available in Haver's USECON and USNA databases.
Regulatory reform is the title of yesterday's speech by Fed Governor Daniel K. Tarullo and it can be found here.
| Disposition of Personal Income (%) | September | August | July | Y/Y | 2008 | 2007 |
|---|---|---|---|---|---|---|
| Personal Income | -0.0 | 0.1 | 0.1 | -2.8 | 2.9 | 5.6 |
| Disposable Personal Income | -0.0 | 0.1 | -0.1 | 0.5 | 3.9 | 4.9 |
| Personal Consumption Expenditures | -0.5 | 1.4 | 0.2 | -0.3 | 3.1 | 5.4 |
| Saving Rate | 3.3 | 2.8 | 4.0 | 2.2 (Sept. '08) | 2.6 | 1.7 |
| PCE Chain Price Index | 0.1 | 0.3 | 0.0 | -0.5 | 3.3 | 2.7 |
| Less food & energy | 0.1 | 0.1 | 0.1 | 1.3 | 2.4 | 2.4 |
by Robert Brusca October 30, 2009
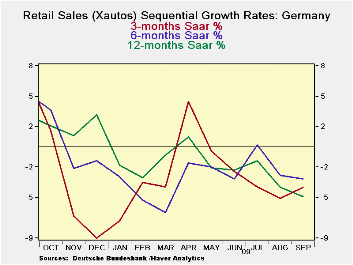
German retail sales fell for the second month in a row. For Q3 sales are now falling at a 4.3% annual rate. Real ex auto sales are dropping in the quarter at a pace of -3.2%. All three month growth rates for key retail categories are declining as are six month growth rates. For most categories the decline in sales is at a steeper annual rate over three months than for six months. With euro Area unemployment at a 10 ½ year high and German firms cutting back on working hours, consumption in Germany has pulled back. This an important issue since the consumer confidence index has been one of the strongest sector indices in the EMU. There is no telling how much the Europe recovery could be set back by a pessimistic consumer.
| German Real and Nominal Retail Sales | QTR | |||||||
|---|---|---|---|---|---|---|---|---|
| Nominal | Sep-09 | Aug-09 | Jul-09 | 3-MO | 6-MO | 12-MO | YrAgo | Saar |
| Retail Ex auto | -0.5% | -1.2% | 0.7% | -4.0% | -3.2% | -4.8% | 3.1% | -4.3% |
| MV and Parts | -0.5% | -1.8% | 1.5% | -3.4% | -3.9% | -4.0% | -0.2% | -3.2% |
| Food Bev & Tobacco | -3.0% | 3.1% | -0.7% | -2.8% | -1.6% | -3.8% | 2.4% | -3.7% |
| Clothing footwear | 2.4% | -7.0% | 3.6% | -5.3% | -3.1% | -5.1% | 1.4% | -5.2% |
| Car registrations (units) | -2.7% | -9.5% | -5.8% | -52.7% | -7.9% | 20.9% | -1.7% | 0.0% |
| Real | ||||||||
| Retail Ex auto | -0.5% | -1.8% | 1.5% | -3.4% | -3.9% | -4.0% | -0.2% | -3.2% |
by Tom Moeller October 30, 2009
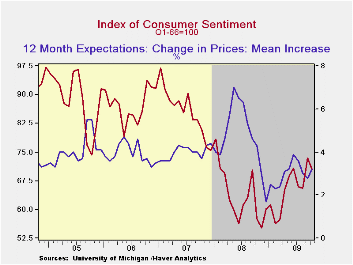
Consumer sentiment for all of October fell from September but the trend during the month improved. The University of Michigan indicated that its October reading of consumer sentiment of 70.6 was improved from the mid-month reading of 69.4 but both figures were down from a September figure of 73.5. Despite the latest decline, sentiment remained up by roughly one-quarter from the low last fall. Consensus expectations had been for a full-month figure of 70. During the last ten years, there has been a 69% correlation between the level of sentiment and the growth in real consumer spending during the next five months.
The October reading of expected economic conditions fell a sharp 6.7% m/m. It was shallower-than reported at mid-month but still erased much of September's gain. The latest decline was led by a 16.5% drop in expected business conditions during the next five years which reversed much of the improvement since July. Expected conditions during the next year fell just modestly and the index remained more-than-double the February low. Conversely, the expected change in personal finances improved slightly with the index rising nearly one-quarter from the low during 2008 with the higher stock market.
The reading of current economic conditions increased
moderately. The readings of personal finances and of buying conditions
for large household goods held steady m/m, but the latter was up by
one-third from the November trough due to low prices.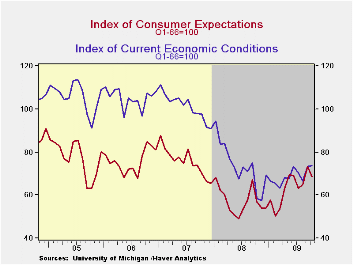
Expected price inflation during the next year amounted to 3.2%, up slightly from September but down from a high of 7.0% during May of last year. A low of 0.3% inflation was expected by 25% of respondents but 5.0% inflation was expected by another quarter. Inflation of 3.2% during the next 5-10 years was the mean expectation.
The opinion of government policy, which may eventually influence economic expectations, fell from September and remained near the lowest level since February. Thirty-two percent of respondents thought that a poor job was being done by government. A reduced 18% thought that a good job was being done, down from 30% in April.
The University of Michigan survey data is not seasonally adjusted. The reading is based on telephone interviews with about 500 households at month-end. These results are based on about 300 interviews. The summary indexes are in Haver's USECON database with details in the proprietary UMSCA database.
Optimism Amid Uncertainty from the Federal Reserve Bank of Dallas is available here.
| University of Michigan | October (Final) | Mid-October | September | August | Oct y/y | 2008 | 2007 | 2006 |
|---|---|---|---|---|---|---|---|---|
| Consumer Sentiment | 70.6 | 69.4 | 73.5 | 65.7 | 22.6% | 63.8 | 85.6 | 87.3 |
| Current Conditions | 73.7 | 72.1 | 73.4 | 66.6 | 26.2 | 73.7 | 101.2 | 105.1 |
| Expectations | 68.6 | 67.6 | 73.5 | 65.0 | 20.4 | 57.3 | 75.6 | 75.9 |
by Tom Moeller October 30, 2009
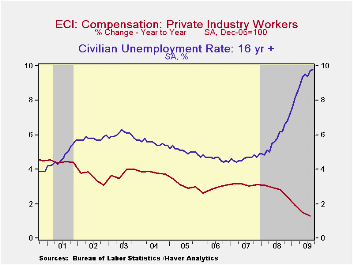 Employment
compensation picked up slightly last quarter, but high unemployment
dragged down the y/y change to its lowest on record. (The series dates
back to 1980). The total employment cost index for private industry
workers rose 0.5% during 3Q following gains of 0.2% during the prior
two quarters. The latest rise about matched Consensus
expectations.
Employment
compensation picked up slightly last quarter, but high unemployment
dragged down the y/y change to its lowest on record. (The series dates
back to 1980). The total employment cost index for private industry
workers rose 0.5% during 3Q following gains of 0.2% during the prior
two quarters. The latest rise about matched Consensus
expectations.
Improved wage and salary growth provided most
of the "oomph" to last quarter's gain with a 0.5% rise. However, here
again, the y/y gain of 1.3% was a new record low. 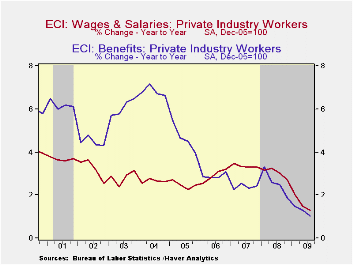 In the factory sector
wages rose just 1.2% y/y but in the education & health care
sectors wages rose a still-modest 1.8%. In the goods producing sector
wage growth fell to just 1.2% and in education & health
services they rose 1.8%.
In the factory sector
wages rose just 1.2% y/y but in the education & health care
sectors wages rose a still-modest 1.8%. In the goods producing sector
wage growth fell to just 1.2% and in education & health
services they rose 1.8%.
Total benefit costs in private sector increased just 0.3% and the 1.0% y/y gain was a record low. What y/y strength there was was led by a 2.3% gain in production, transportation & materials handling industries and a 1.6% rise in services occupations. The cost of health benefits showed a stable 4.7% rise in the latest 12 months. · The employment cost index figures are available in Haver's USECON database.
Financial Intermediaries and Monetary Economics from the Federal Reserve Bank of New York can be found here.
| ECI - Private Industry Workers (%) | 3Q '09 | 2Q '09 | 1Q '09 | 3Q Y/Y | 2008 | 2007 | 2006 |
|---|---|---|---|---|---|---|---|
| Compensation | 0.5 | 0.2 | 0.2 | 1.3 | 2.8 | 3.1 | 2.9 |
| Wages & Salaries | 0.5 | 0.2 | 0.2 | 1.3 | 3.0 | 3.4 | 2.9 |
| Benefit Costs | 0.3 | 0.2 | 0.2 | 1.0 | 2.6 | 2.4 | 2.9 |

Tom Moeller
AuthorMore in Author Profile »Prior to joining Haver Analytics in 2000, Mr. Moeller worked as the Economist at Chancellor Capital Management from 1985 to 1999. There, he developed comprehensive economic forecasts and interpreted economic data for equity and fixed income portfolio managers. Also at Chancellor, Mr. Moeller worked as an equity analyst and was responsible for researching and rating companies in the economically sensitive automobile and housing industries for investment in Chancellor’s equity portfolio. Prior to joining Chancellor, Mr. Moeller was an Economist at Citibank from 1979 to 1984. He also analyzed pricing behavior in the metals industry for the Council on Wage and Price Stability in Washington, D.C. In 1999, Mr. Moeller received the award for most accurate forecast from the Forecasters' Club of New York. From 1990 to 1992 he was President of the New York Association for Business Economists. Mr. Moeller earned an M.B.A. in Finance from Fordham University, where he graduated in 1987. He holds a Bachelor of Arts in Economics from George Washington University.
More Economy in Brief


