 Global| May 26 2006
U.S. Personal Income Gain Light, Wages Soared, Prices Up
by:Tom Moeller
|in:Economy in Brief
Summary
Personal income rose 0.5% last month following a downwardly revised 0.5% gain during March. The latest compared to Consensus expectations for a 0.7% increase. Wage & salary disbursements soared 0.9% (5.3% y/y) following an upwardly [...]

Personal income rose 0.5% last month following a downwardly revised 0.5% gain during March. The latest compared to Consensus expectations for a 0.7% increase.
Wage & salary disbursements soared 0.9% (5.3% y/y) following an upwardly revised 0.5% March increase. Private sector wages jumped 1.0% (5.7% y/y) as strong gains were logged in manufacturing (0.7%, 2.8% y/y) and in service producing industries (1.1%, 6.1% y/y).
Government transfer payments for health insurance & disability rose 0.6% (11.4% y/y) and a March surge was revised down.
Disposable personal income increased 0.4% (4.7% y/y) but a revised 0.4% gain in March was half that initially reported. Personal taxes jumped 1.6% (10.7% y/y).
Personal consumption matched Consensus expectations for a 0.6% rise. Adjusted for price inflation, spending rose 0.1% (3.1% y/y) for the second consecutive month. Real spending on gasoline & oil jumped 1.7% (0.8% y/y) following two months of decline.
The PCE chain price index rose 0.5% boosted by an 8.7% (19.1% y/y) surge in gasoline & oil prices. Less food & energy the chain price index increased 0.2% (2.1% y/y), down from the 0.3% gain in March. Prices for clothing & shoes rose 0.4% (-0.7% y/y) but furniture & household equipment prices fell another 0.4% (-4.8% y/y).
The personal savings rate was a negative 1.6% in April and recent figures were revised more negative.
The Trend Growth Rate of Employment: Past, Present and Future from the Federal Reserve Bank of Kansas City is available here.
| Disposition of Personal Income | April | Mar | Y/Y | 2005 | 2004 | 2003 |
|---|---|---|---|---|---|---|
| Personal Income | 0.5% | 0.5% | 5.4% | 5.4% | 5.9% | 3.2% |
| Personal Consumption | 0.6% | 0.5% | 6.2% | 6.5% | 6.5% | 4.9% |
| Savings Rate | -1.6% | -1.4% | -0.2% (April '05) | -0.5% | 1.7% | 2.1% |
| PCE Chain Price Index | 0.5% | 0.4% | 2.9% | 2.8% | 2.6% | 1.9% |
| Less food & energy | 0.2% | 0.3% | 2.1% | 2.0% | 2.0% | 1.3% |
by Tom Moeller May 26, 2006
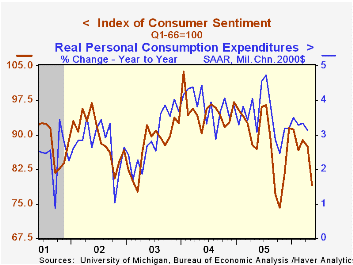
The University of Michigan reported that for all of May, consumer sentiment held steady at the preliminary level indicated two weeks ago. Nevertheless, sentiment fell 9.5% m/m to 79.1, the lowest level since last October. Consensus expectations had been for some improvement to 79.4.
During the last ten years there has been a 77% correlation between the level of consumer sentiment and the y/y change in real consumer spending.
Expectations for the economy dropped 7.1% m/m as higher gasoline prices boosted the twelve month mean expected inflation rate to 4.7% versus 3.6% expected in February. That dragged expectations for personal finances down 10.4% m/m and expected business conditions down 5.8%.
The current conditions index fell 12.0% m/m, the same as the mid-month read. The current index of personal finances dropped 14.3% (-6.4% y/y) and the reading of buying conditions for large household goods dropped 10.9% (-9.8% y/y).
Consumers' assessment of gov't economic policy fell 8.3% m/m (-10.5% y/y) and is at nearly half the level of early 2000.
The University of Michigan survey is not seasonally adjusted.The mid-month survey is based on telephone interviews with 250 households nationwide on personal finances and business and buying conditions. The survey is expanded to a total of 500 interviews at month end.
| University of Michigan | May (final) | May (prelim. | April | Y/Y | 2005 | 2004 | 2003 |
|---|---|---|---|---|---|---|---|
| Consumer Sentiment | 79.1 | 79.0 | 87.4 | -9.0% | 88.6 | 95.2 | 87.6 |
| Current Conditions | 96.1 | 96.2 | 109.2 | -8.4% | 105.9 | 105.6 | 97.2 |
| Expectations | 68.2 | 68.0 | 73.4 | -9.4% | 77.4 | 88.5 | 81.4 |
by Carol Stone May 26, 2006
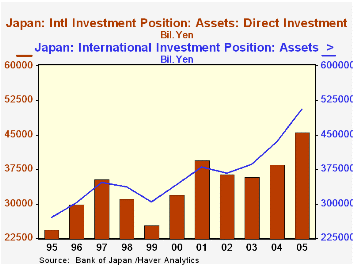
The Bank of Japan today reported on Japan's international investment position for year-end 2005. Total assets abroad stood at ¥506.2 trillion, up 16.7% from the end of 2004. All of the major asset categories climbed by significant amounts, such as direct investment abroad, which was up 18.2%, and holdings of equity securities, which rose 26.9%.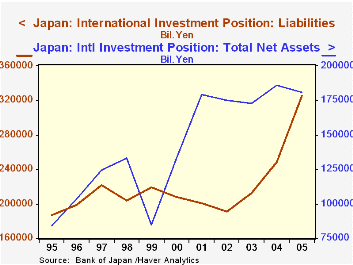
We find it interesting that both of the equity components, direct investment and equity securities holdings, constitute only moderate amounts of total assets abroad. Equities were 5.6% of total international assets at the end of 1995; while they have increased, they still constitute just 9.5% of Japanese investors' holdings abroad. Direct investment has ranged between 8.4% and 10.4% of total assets over the 11-year history of these data; at the end of 2005, this item was 9% of the total. It was also right at 9% of Japanese GDP for the year. In contrast, US direct ownership interests abroad constituted 26.2% of total US assets abroad and 20.2% of US GDP in 2004 (latest available).
Foreign investors have interests in Japan, of course, and at the end of 2005, these totaled ¥325.9 trillion, up a sizable 31.2% from year-end 2004. The gain was concentrated in equity securities, which increased 71.6%, helped by the 40.2% surge in Japanese stock prices (measured by the Nikkei 225). Foreign direct investment in Japan rose 17.9%, but it is a much smaller amount, only ¥11.9 billion.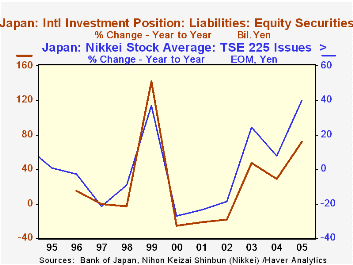
With the big gain in the value of liabilities to foreigners, Japan's net investment position actually decreased in 2005, falling 2.7% to ¥180.7 billion. Sometimes such a movement is seen as unhealthy for a country. But on this occasion, it seems more to reflect the emerging improvement in Japan that makes it more attractive for investment.
In releasing these data today, the Bank of Japan added industry and country detail. Haver Analytics will be adding these data to the JAPAN database soon. They will greatly enhance the understanding Japan's capital flows and values in world markets.
| Japan: End of Year, Bil.¥ | 2005 | 2004 | 2003 | 2000 | 1995 |
|---|---|---|---|---|---|
| Assets Abroad | 506,191 | 433,864 | 385,538 | 341,206 | 270,738 |
| Direct Investment | 45,605 | 38,581 | 35,932 | 31,993 | 24,520 |
| Portfolio Investment | 249,493 | 209,247 | 184,353 | 150,115 | 88,257 |
| Equity | 48,200 | 37,972 | 29,394 | 30,133 | 15,040 |
| Debt Securities | 201,294 | 171,275 | 154,959 | 119,982 | 73,217 |
| Domestic Liabilities | 325,942 | 248,067 | 212,720 | 208,159 | 186,666 |
| Direct Investment | 11,903 | 10,098 | 9,610 | 5,782 | 3,448 |
| Portfolio Investment | 181,959 | 120,091 | 92,873 | 101,609 | 56,379 |
| Loans | 98,105 | 90,776 | 83,665 | 76,212 | 97,759 |
| Net Assets | 180,699 | 185,797 | 172,818 | 133,047 | 84,072 |

Tom Moeller
AuthorMore in Author Profile »Prior to joining Haver Analytics in 2000, Mr. Moeller worked as the Economist at Chancellor Capital Management from 1985 to 1999. There, he developed comprehensive economic forecasts and interpreted economic data for equity and fixed income portfolio managers. Also at Chancellor, Mr. Moeller worked as an equity analyst and was responsible for researching and rating companies in the economically sensitive automobile and housing industries for investment in Chancellor’s equity portfolio. Prior to joining Chancellor, Mr. Moeller was an Economist at Citibank from 1979 to 1984. He also analyzed pricing behavior in the metals industry for the Council on Wage and Price Stability in Washington, D.C. In 1999, Mr. Moeller received the award for most accurate forecast from the Forecasters' Club of New York. From 1990 to 1992 he was President of the New York Association for Business Economists. Mr. Moeller earned an M.B.A. in Finance from Fordham University, where he graduated in 1987. He holds a Bachelor of Arts in Economics from George Washington University.
More Economy in Brief


