 Global| Nov 30 2006
U.S. Personal Income Gain Light, Core Prices Firmer
by:Tom Moeller
|in:Economy in Brief
Summary
Personal income for October rose a bit less than expectations with a 0.4% increase after an unrevised 0.5% September gain. The disappointment in last month's income gain, however, was confined to a 3.9% (-8.7% y/y) decline in rental [...]
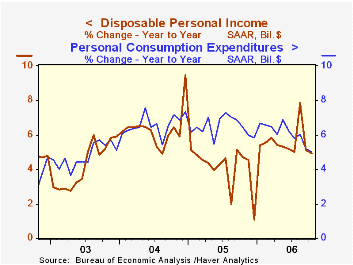
Personal income for October rose a bit less than expectations with a 0.4% increase after an unrevised 0.5% September gain.
The disappointment in last month's income gain, however, was confined to a 3.9% (-8.7% y/y) decline in rental income and a slim 0.1% (2.4% y/y) increase in proprietors' income.
Wage & salary disbursements jumped 0.6% (5.9% y/y) after an upwardly revised like gain during September. Wages in the private service-producing industries surged 0.7% (6.4% y/y) and factory sector wages grew 0.6% (2.8% y/y) following an upwardly revised 0.1% September uptick. Revisions to the figures for April through September lowered the level of wages & salaries.
Disposable personal income increased 0.3% (4.9% y/y) after an unrevised 0.5% September increase. Personal taxes jumped 1.2% (12.1% y/y).
Personal consumption rose 0.2% after the downwardly revised 0.2% September decline. Expectations had been for a 0.1% increase. When adjusted for the 0.2% decline in prices, real consumer spending rose 0.4%. A 2.8% m/m decline in unit vehicle sales last month held back the gain in PCE along with a 9.8% m/m decline (-16.8% y/y) in spending on gasoline & oil.
The PCE chain price index fell 0.2%, helped by last month's 12.1% decline in retail gasoline prices. Gasoline prices in November are down another 0.7% m/m. The 0.2% rise in prices less food & energy prices was a bit firmer than expectations for a 0.1% uptick. In addition, the three month change in core prices crept higher to 2.7% (AR).
Interest income rose 0.4% (7.6% y/y) while dividend income jumped another 1.1% (11.6% y/y).
The personal savings rate was a slightly less negative -0.6% last month but so far in 2006 has averaged -0.9%. Should the Decline in the Personal Saving Rate Be a Cause for Concern? from the Federal Reserve Bank of Kansas City is available here.
The Fed's latest Beige Book covering economic conditions around the country can be found here.
| Disposition of Personal Income | October | September | Y/Y | 2005 | 2004 | 2003 |
|---|---|---|---|---|---|---|
| Personal Income | 0.4% | 0.5% | 5.8% | 5.2% | 6.2% | 3.2% |
| Personal Consumption | 0.2% | -0.2% | 5.0% | 6.5% | 6.6% | 4.8% |
| Savings Rate | -0.6% | -0.7% | -0.3% (Oct. '05) | -0.4% | 2.0% | 2.1% |
| PCE Chain Price Index | -0.2% | -0.3% | 1.5% | 2.9% | 2.6% | 2.0% |
| Less food & energy | 0.2% | 0.2% | 2.4% | 2.1% | 2.0% | 1.4% |
by Tom Moeller November 30, 2006
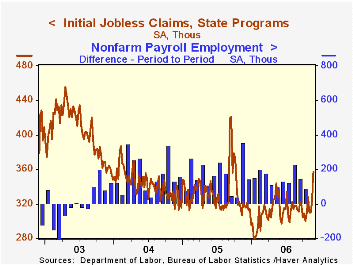
Initial claims for unemployment insurance jumped 34,000 last week to 357,000 from an upwardly revised level during the prior period. Consensus expectations had been for a decline to 317,000.
No specific factors were sighted by the Labor Department for the increase but volatility related to large seasonal factors often occurs around the Thanksgiving holiday. The seasonally unadjusted number of initial claims fell 45,203 last week.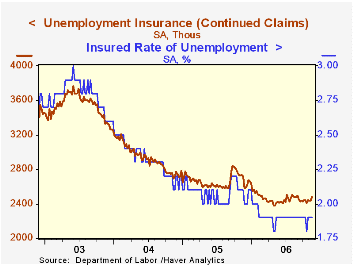
During the last ten years there has been a (negative) 77% correlation between the level of initial claims and the m/m change in nonfarm payroll employment.
The four-week moving average of initial claims rose to 325,000 (3.0% y/y), its highest level since June.
Continuing claims for unemployment insurance also jumped by 45,000 after a downwardly revised 5,000 worker decline the prior week.
The insured rate of unemployment remained at 1.9%, the average rate since February.
| Unemployment Insurance (000s) | 11/25/06 | 11/18/06 | Y/Y | 2005 | 2004 | 2003 |
|---|---|---|---|---|---|---|
| Initial Claims | 357 | 323 | 12.6% | 332 | 343 | 403 |
| Continuing Claims | -- | 2,480 | -8.5% | 2,662 | 2,924 | 3,532 |
by Tom Moeller November 30, 2006
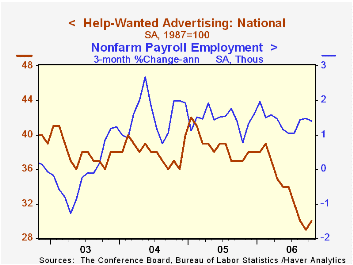
The Conference Board reported that its Index of Help-Wanted Advertising in October ticked up to 30 in October from a downwardly revised reading of 29 in September.
During the last ten years there has been a 57% correlation between the level of help-wanted advertising and the three month change in non-farm payrolls.
The proportion of labor markets with rising want-ad volume surged to 57%, the highest level in nearly one year.
The Conference Board surveys help-wanted advertising volume in 51 major newspapers across the country every month.
The latest help wanted report from the Conference Board is available here.
| Conference Board | October | September | October '05 |
|---|---|---|---|
| National Help Wanted Index | 30 | 29 | 37 |
by Tom Moeller November 30, 2006
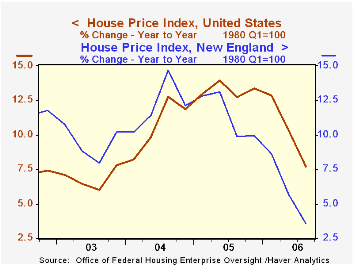
According to the Office of Federal Housing Enterprise Oversight (OFHEO) home prices in the U.S. rose last quarter but the 0.9% gain was the slowest since 1998 and the y/y increase of 7.7% was the worst since 2003.
Price declines were scattered throughout the country. Job cutbacks in the auto industry helped lower prices in Michigan for the second consecutive quarter and in New York a 0.3% decline dropped the y/y rate of home price appreciation to 6.5%, the worst since 1999. Prices also fell q/q in Massachusetts (for the second quarter, +1.1% y/y), Rhode Island (+4.6% y/y) and New Hampshire (+3.7% y/y).
Home price appreciation in the District of Columbia continued reasonably firm last quarter at 1.0% but the still healthy y/y gain of 11.3% was down from last year's peak of 25.2%. Home prices in Idaho also turned in a strong showing with a 3.0% (17.5% y/y) increase. Notable for strength also were prices in Florida which rose 1.2% (15.1% y/y) though that is down from a 25.9% gain during all of last year.
The House Price Indices in this report are weighted indexes based on repeat sales or refinancings using data provided by Fannie Mae or Freddie Mac .
The latest report from the Office of Federal Housing Enterprise Oversight (OFHEO) can be found here.
| House Price Index (OFHEO) | 3Q '06 | 2Q '06 | Y/Y | 2005 | 2004 | 2003 |
|---|---|---|---|---|---|---|
| United States | 0.9% | 1.3% | 7.7% | 13.2% | 10.7% | 6.9% |
| California | 0.6% | 1.5% | 10.2% | 23.4% | 22.3% | 12.3% |
| New Jersey | 0.8% | 1.8% | 9.2% | 16.3% | 14.9% | 10.6% |
| New York | -0.3% | 1.0% | 6.5% | 13.8% | 13.3% | 10.4% |
| Michigan | -0.5% | -0.7% | -0.6% | 4.3% | 4.3% | 3.4% |
by Tom Moeller November 30, 2006
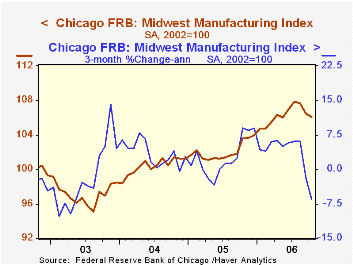
The Chicago Federal Reserve Bank's Midwest manufacturing index fell 0.4% last month and it was the third consecutive monthly decline. The three month growth rate in the index dropped to -6.5% (AR), its worst since 2003.
During the last ten years there has been a 89% correlation between the y/y change in Chicago's Midwest Mfg. index and the change in US factory sector industrial production. The October Chicago Fed Midwest Manufacturing Index can be found here.
The auto sector index registered its fifth decline in the last six months while the steel index fell for the third consecutive month. The machinery index, however, reflected the firm capital goods sector and rose moderately (6.7% y/y).
Industrial Ecology: Environmental and Economic Boon from the Federal Reserve Bank of Boston can be found here.
| Federal Reserve Surveys | October | September | Oct. '05 | 2005 | 2004 | 2003 |
|---|---|---|---|---|---|---|
| Chicago Fed Midwest Mfg. Index (2002 = 100) | 106.1 | 106.5 | 103.6 | 102.1 | 100.4 | 97.1 |
by Carol Stone November 30, 2006

The Canadian economy slowed in Q3, according to the national accounts array published today by Statistics Canada. GDP grew only 1.7% at an annual rate from Q2, slower than Q2's 2.0% and also less than the 2.0% widely expected by Canadian economists. It was the weakest performance since Q2 2003, when there was a decline of 1.3%. 
The slowdown was not a result of weaker consumer spending; this actually strengthened to 4.2% growth from 3.8% in Q2 and was 4.1% ahead of a year ago, compared with year-on-year growth of 2.5% for total GDP. And private nonresidential fixed investment, often the generator of business cycles, also picked up, growing at a 7.0% pace compared with 5.4% in Q2.Further, net exports, while deteriorating, did so less than in Q2, as that deficit inched outward by only C$0.8 billion, following a sharp widening in Q2 of C$12.2 billion.
So the slowing in this one quarter was due primarily to a marked deceleration in government consumption and to further declines in housing investment. The swing in the government accounts related to the quinquennial census that was taken in mid-May. This created a bulge in government spending from Q4 2005 through Q2 2006. A quick look at the second graph shows the periodic slowdowns following these 5-year censuses, previously taken in 1996 and 2001. 
Residential construction deepened its decline that set in during Q2 after the huge seasonally adjusted advance during last winter, which as we in the US know, was quite mild. Residential investment in Canada jumped 14.2% (annualized) in Q1 and has almost exactly offset that in Q2 and Q3, so the latest figure is very close to the C$68.8 billion in the second half of last year.
These sources of weakness appear to be temporary adjustments to outsized gains earlier. But before dismissing them as mere jiggles in numbers, it gives us pause that the other compilation of Canada's GDP, the industrial product breakdown calculated monthly, showed an outright contraction in September of 0.3%. So the economy ended the quarter on a down note, not a very promising position.
| CANADA: SAAR, Bil.Chn97C$ |
Q3 2006 | Q2 2006 | Q1 2006 | Year- Ago | 2005 | 2004 | 2003 |
|---|---|---|---|---|---|---|---|
| Total GDP | 1192.2 | 1187.1 | 1181.1 | 1162.8 | 1157.7 | 1124.7 | 1088.8 |
| % Chg, AR | 1.7 | 2.0 | 3.8 | 2.5 | 2.9 | 3.3 | 1.8 |
| Personal Consumption | 4.2 | 3.8 | 4.8 | 4.1 | 3.9 | 3.3 | 3.0 |
| Gov't Consumption | 0.7 | 4.9 | 3.3 | 3.3 | 2.7 | 3.0 | 3.5 |
| Business Investment | 1.2 | 1.6 | 10.3 | 5.0 | 7.1 | 8.6 | 6.6 |
| Net Exports (Bil.Chn.97C$) | -23.3 | -22.5 | -10.3 | -- | -2.0 | +19.8 | +30.6 |
by Tom Moeller November 30, 2006
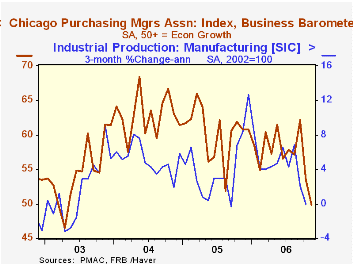
The Chicago Purchasing Manager's Assn. reported that its November business barometer fell to 49.9. It was the first month the diffusion index of factory sector activity fell below the break even line of 50 since 2003.
During the last ten years there has been a 69% correlation between the index and the three month change in US factory sector industrial production.
All of the component series weakened m/m with the employment index falling to 49.4 versus an average 54.2 last year and new orders fell to 52.0 versus a 2005 average of 64.4.
The prices paid index dropped to 60.2, its lowest level since since May of last year.During the last ten years there has been an 89% correlation between the level of the prices diffusion index and the three month change in the core PPI for intermediate good.
| Chicago PMI | November | October | Nov. '05 | 2005 | 2004 | 2003 |
|---|---|---|---|---|---|---|
| Chicago PMI Business Barometer Index | 49.9 | 53.5 | 60.8 | 60.4 | 62.8 | 54.7 |

Tom Moeller
AuthorMore in Author Profile »Prior to joining Haver Analytics in 2000, Mr. Moeller worked as the Economist at Chancellor Capital Management from 1985 to 1999. There, he developed comprehensive economic forecasts and interpreted economic data for equity and fixed income portfolio managers. Also at Chancellor, Mr. Moeller worked as an equity analyst and was responsible for researching and rating companies in the economically sensitive automobile and housing industries for investment in Chancellor’s equity portfolio. Prior to joining Chancellor, Mr. Moeller was an Economist at Citibank from 1979 to 1984. He also analyzed pricing behavior in the metals industry for the Council on Wage and Price Stability in Washington, D.C. In 1999, Mr. Moeller received the award for most accurate forecast from the Forecasters' Club of New York. From 1990 to 1992 he was President of the New York Association for Business Economists. Mr. Moeller earned an M.B.A. in Finance from Fordham University, where he graduated in 1987. He holds a Bachelor of Arts in Economics from George Washington University.


