 Global| Dec 22 2006
U.S. Personal Income Again Light, Core Prices Ease
by:Tom Moeller
|in:Economy in Brief
Summary
November personal income again rose a bit less than expectations with a 0.3% increase after a downwardly revised 0.3% increase in October. The PCE chain price index was unchanged after an unrevised 0.2% decline in October. Prices less [...]
November personal income again rose a bit less than expectations with a 0.3% increase after a downwardly revised 0.3% increase in October.
The PCE chain price index was unchanged after an unrevised 0.2% decline in October. Prices less food & energy also were unchanged for the first time since 2002. The three month change in core prices fell to 1.8% (AR) and the six month change fell to 2.1%, its lowest this year.
Disappointment in income continued as rental income fell 2.8% (-7.9% y/y) after a downwardly revised 4.7% skid in October. Proprietors' income also rose just 0.1% (2.9% y/y) but October's increase was revised up to 0.6%.
Wage & salary disbursements increased 0.3% (6.3% y/y) although the October increase was lessened a bit to 0.5%. Factory sector wages slipped marginally (+3.9% y/y) following a downwardly revised 0.4% gain while wages in the private service-producing industries rose a moderate 0.4% (6.8% y/y).
Interest income rose 0.4% (6.3% y/y) for the second month and dividend income surged 1.1% (11.7% y/y) for the third month.
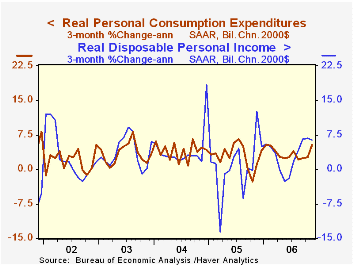
Disposable personal income increased 0.3% (5.1% y/y) after a downwardly revised 0.2% October. Personal taxes increased 0.5% (11.8% y/y) after the 1.1% October jump.
Real disposable personal income rose 0.3% (3.2% y/y) last month and the three month growth in real income was 6.4% (AR). Real disposable income per capita rose 0.2% (2.2% y/y) and three month growth was 5.4% (AR).Personal consumption surged 0.5% after the upwardly revised 0.3% gain during October. Expectations had been for a 0.6% increase. Real consumer spending rose 0.5%, the same as in October.
The personal savings rate was a more negative -1.0% last month and so far in 2006 has averaged -0.9%. Should the Decline in the Personal Saving Rate Be a Cause for Concern? from the Federal Reserve Bank of Kansas City is available here.
| Disposition of Personal Income | November | October | Y/Y | 2005 | 2004 | 2003 |
|---|---|---|---|---|---|---|
| Personal Income | 0.3% | 0.3% | 5.9% | 5.2% | 6.2% | 3.2% |
| Personal Consumption | 0.5% | 0.3% | 5.7% | 6.5% | 6.6% | 4.8% |
| Savings Rate | -1.0% | -0.7% | -0.3% (Nov. '05) | -0.4% | 2.0% | 2.1% |
| PCE Chain Price Index | 0.0% | -0.2% | 1.9% | 2.9% | 2.6% | 2.0% |
| Less food & energy | 0.0% | 0.2% | 2.2% | 2.1% | 2.0% | 1.4% |
by Tom Moeller December 22, 2006

New orders for durable goods rose 1.9% last month, a gain after the offsetting volatility of the prior two months when orders fell 8.2% in October after an 8.7% September spike. Consensus expectations had been for a 1.5% rise n total orders during November.
During the last ten years there has been a 69% correlation between the y/y change in durable goods orders and the change in output of durable goods..
A 14.4% rise in total aircraft & parts orders last month, however, still added volatility. In addition, orders for motor vehicles & parts rose 0.2% (-3.9% y/y). Less transportation altogether, slipped 1.1%.
And broad based order declines in other industries continued to raise questions about the health of the factory sector. Orders for nondefense capital goods less aircraft fell 1.4% reflecting a 1.5% (+5.2% y/y) slide in electrical equipment orders and an 8.9% (+3.8% y/y) drop in machinery. During the last ten years there has been an 86% correlation between the y/y change in capital goods orders less aircraft and the y/y change in business fixed investment in equipment & software from the GDP accounts.
Primary metals orders fell 1.9% (+4.1% y/y), down for the third month in the last four. To the upside were orders for computer s & electronic products which rose 7.5% (10.4% y/y).
Shipments of durable goods increased another slight 0.1% (2.7% y/y) after the downwardly revised 0.3% October uptick. Less the transportation sector shipments fell 0.1% (+4.6% y/y) for the second decline in the last three months. During the last ten years there has been an 82% correlation between the y/y change in durable goods shipments and the change in industrial production of durable goods.
Durable inventories rose just 0.3% (7.8% y/y), the weakest monthly increase since a decline in February. Less the transportation sector inventories also increased a modest 0.2% (8.4% y/y) and the inventory to shipments ratio outside of transportation rose to the highest level since July of last year.
| NAICS Classification | November | October | Y/Y | 2005 | 2004 | 2003 |
|---|---|---|---|---|---|---|
| Durable Goods Orders | 1.9% | -8.2% | -0.0% | 9.0% | 6.4% | -0.6% |
| Excluding Transportation | -1.1% | -1.6% | 3.4% | 9.4% | 7.6% | -1.7% |
| Nondefense Capital Goods | -0.2% | -14.8% | -8.4% | 21.4% | 5.6% | -3.4% |
| Excluding Aircraft | -1.4% | -3.9% | 6.2% | 12.3% | 2.8% | -2.0% |
by Tom Moeller December 22, 2006
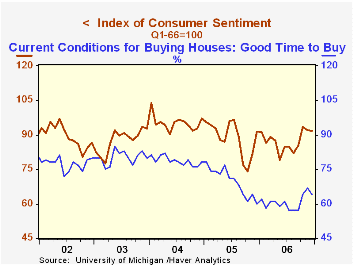
The University of Michigan's full month reading of consumer sentiment in December slipped 0.4% to 91.7, but that was less than the 2.1% drop in the preliminary report. Consensus expectations for a reading of 90.2.
During the last ten years there has been a 76% correlation between the level of consumer sentiment and the y/y change in real consumer spending and during those ten years sentiment has a 68% correlation with the change in nonfarm payrolls.
Consumer expectations for the economy improved from the preliminary read but they still fell 2.4% for the second consecutive monthly decline. Business conditions during the next twelve months fell 6.3% (+1.0% y/y) and long term expected business cosnditions were unchanged for the second month (+10.2% y/y). Expected personal finances slipped for the second consecutive month (-3.9% y/y).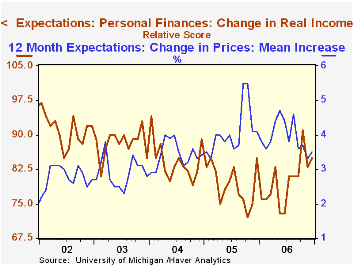
The reading of current economic conditions actually improved 2.0%, about the same as in the preliminary report. Perceived buying conditions for large household goods rose 3.2% (-1.8% y/y) but perceptions of current personal finances were unchanged (0.0s% y/y).
The reading of whether it's a good time to buy house fell m/m but remained up from the lows this past Summer.
Expected inflation during the next year increased to 3.5% but for the next five years expected inflation fell to 3.4%. Since 1980 there has been an inverse 63% correlation between the level of sentiment and expected inflation during the next year.
Consumers' opinion about gov't economic policy slipped m/m to just 89 versus a midmonth read of 86.
The University of Michigan survey is not seasonally adjusted.The mid-month survey is based on telephone interviews with 250 households nationwide on personal finances and business and buying conditions. The survey is expanded to a total of 500 interviews at month end.
| University of Michigan | December (Final) | December (Prelim. | November | Y/Y | 2006 | 2005 | 2004 |
|---|---|---|---|---|---|---|---|
| Consumer Sentiment | 91.7 | 90.2 | 92.1 | 0.2% | 87.2 | 88.6 | 95.2 |
| Current Conditions | 108.1 | 108.2 | 106.0 | -0.9% | 105.1 | 105.9 | 105.6 |
| Expectations | 81.2 | 78.6 | 83.2 | 1.2% | 75.7 | 77.4 | 88.5 |
by Carol Stone December 22, 2006
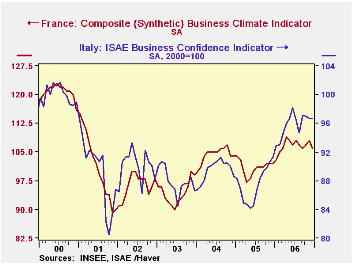
Businesses in France and Italy, mostly manufacturers, reported some tapering down of confidence in December surveys. Conditions in general are much better than in the previous couple of years, but readings in these surveys have eased since the summer.
In France, the INSEE monthly survey was off 2 points in December to 106 from 108 in November. This put the average for all of 2006 at 107. The December value is up from 102 last December and the average of 101 for all of 2005. These indexes are a synthetic measure, scaled to average 100 over time. So businesses assess their conditions as 7% "better than average" this month.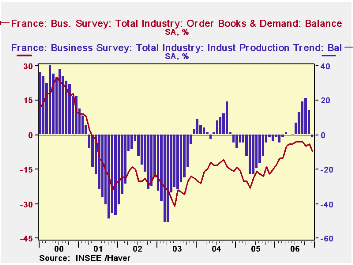
The mixed and skittish nature of business conditions is suggested, though, by the fact that the current assessment of industrial production dropped suddenly to -2 in December from +14 and +21 in November and October, respectively. These data are net balances, the percentage experiencing or expecting positive outcomes less the percentage on the negative side. Wide swings tend to appear in these French data, so it's hard to judge the significance of any single month. Order books also give an ambiguous picture. The net balance in December was -7, worse than recent readings, particularly the -3 that prevailed in July, August and September. However, such erosion is modest compared with the much bigger declines that characterized the last five years.
In Italy, the privately conducted ISAE survey showed flat business confidence in December at 96.7 on a base of 2000=100. The peak in this survey was 98.2 in June. All of 2006 averaged 95.8, a noticeable improvement from readings in the mid-to-high 80s that carried through from 2001 until this year. Near-term production forecasts eased to +17 from a peak of +23 in June, but again, lower expectations were the norm for much of the time since 2001. Order books at Italian companies are even clearer in this distinction: the December balance is +5, the highest number since November 2000, and in fact the non-negative readings since June are the first since December 2000.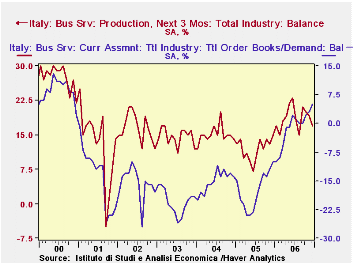
So industry in Italy and France is experiencing improved conditions, suggesting they have weathered the near-recession in 2000-2001 and the growing competition from Asian manufacturers. But we'd guess that recent high energy and commodity prices, along with a strong euro, have slowed them down lately. Hopefully the let-up in oil and copper prices will help stabilize their activity, although other metals, especially tin, lead and nickel, are still strong.
| Business Surveys, SA | Dec 2006 | Nov 2006 | Oct 2006 | Year Ago | 2006 | 2005 | 2004 |
|---|---|---|---|---|---|---|---|
| FRANCE: Business Climate Indicator | 106 | 108 | 107 | 102 | 107 | 101 | 104 |
| Industrial Production Trend, % Bal | -2 | 14 | 21 | -4 | 5 | -12 | 5 |
| Order Books | -7 | -4 | -5 | -15 | -6 | -17 | -15 |
| ITALY: ISAE Business Confidence Indicator, 2000=100 | 96.7 | 96.7 | 97.0 | 91.4 | 95.8 | 87.5 | 89.5 |
| Production Forecast, % Bal | 17 | 19 | 20 | 15 | 19 | 12 | 15 |
| Order Books | 5 | 3 | 2 | -10 | -1 | -18 | -15 |

Tom Moeller
AuthorMore in Author Profile »Prior to joining Haver Analytics in 2000, Mr. Moeller worked as the Economist at Chancellor Capital Management from 1985 to 1999. There, he developed comprehensive economic forecasts and interpreted economic data for equity and fixed income portfolio managers. Also at Chancellor, Mr. Moeller worked as an equity analyst and was responsible for researching and rating companies in the economically sensitive automobile and housing industries for investment in Chancellor’s equity portfolio. Prior to joining Chancellor, Mr. Moeller was an Economist at Citibank from 1979 to 1984. He also analyzed pricing behavior in the metals industry for the Council on Wage and Price Stability in Washington, D.C. In 1999, Mr. Moeller received the award for most accurate forecast from the Forecasters' Club of New York. From 1990 to 1992 he was President of the New York Association for Business Economists. Mr. Moeller earned an M.B.A. in Finance from Fordham University, where he graduated in 1987. He holds a Bachelor of Arts in Economics from George Washington University.
More Economy in Brief


