 Global| Dec 05 2008
U.S. Payrolls Slashed 533,000;6.7% Jobless Rate Highest Since 1993
by:Tom Moeller
|in:Economy in Brief
Summary
Nonfarm payrolls were slashed during November by the most during any one month since December 1974. The 533,000 decline followed shortfalls of 320,000 and 403,000 during October and September, both of which were larger than reported [...]
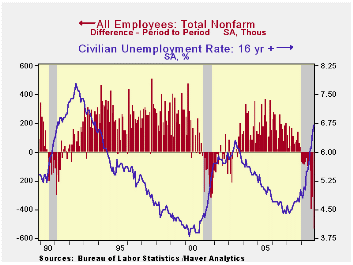
Nonfarm payrolls were slashed during November by the most during any one month since December 1974. The 533,000 decline followed shortfalls of 320,000 and 403,000 during October and September, both of which were larger than reported earlier by the Bureau of Labor Statistics. Also, the latest exceeded Consensus expectations for a 323,000 drop. So far in 2008, nonfarm payrolls are down 1.9 mil., or 1.4%.
During the last three months, payrolls fell at a 3.6% annual rate. That is the quickest rate of decline since during the recession of 1980.
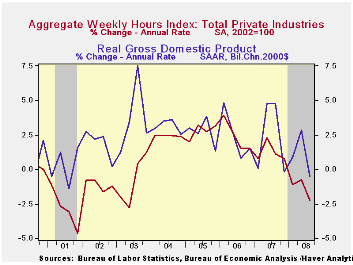
 Aggregate hours worked, which is employment times the length
of the average workweek, so far in 4Q are down at a 4.0% annual rate.
During the last thirty years there has been a 73% correlation between
the growth in aggregate hours worked and real GDP growth.
Aggregate hours worked, which is employment times the length
of the average workweek, so far in 4Q are down at a 4.0% annual rate.
During the last thirty years there has been a 73% correlation between
the growth in aggregate hours worked and real GDP growth.
The unemployment rate rose further to 6.7% last month, the highest level since October 1993. The increase fell short of Consensus expectations for a rise to 6.8%. The jump owed to a 673,000 drop in employment (-1.6% y/y), as measured in the household survey. The latest monthly drop in household sector employment was the ninth this year and was the largest since the recession of 2001.
The number of those who were unemployed last month rose 251,000 (43.9% y/y). The figure is up 2.676 million, or 35.0%, so far this year. The November labor force fell 422,000 (+0.5% y/y) and the y/y rate of increase dropped to near its slowest since 2004. The labor force participation rate fell to 65.9% as the number of "discouraged" workers, i.e. the number of people of who want a job but are not in the labor force, jumped 398,000. The y/y increase of 15.2% is near the strongest in over ten years.
The average duration of unemployment slipped to 18.8 weeks after having increased during October by more than one full week. The median duration of unemployment also slipped m/m to 10.0 weeks, up from 8.5 weeks during all of last year. The number of those unemployed for more than 27 weeks also slipped m/m. Nevertheless it remained up by more than one-half versus last November and at the highest since 1992.
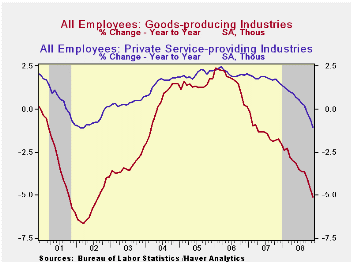
From the establishment survey the number of private sector jobs fell 540,000 (-1.8% y/y) after a 362,000 decline during October, initially reported as down by 263,000. Private service sector industries shed 377,000 jobs (-3.1% y/y) and that was the tenth decline in the last eleven months. Employment in professional & business services fell 136,000 (-2.7% y/y) led by a 111,800 decline in the administrative & waste category which was off 6.2% y/y. Temporary help services jobs, which often are a leading indicator of employment growth, fell 78,200 (-15.4% y/y). That was the largest y/y decline since 2001. Jobs in the leisure & hospitality sector fell 76,000 (-1.0% y/y) while employment in financial industries fell 32,000 (-1.8% y/y), a rate of decline that has more than doubled during the last three months. Retail sector jobs fell another 91,300 (-3.0% y/y) and the rate of decline also has doubled recently. Finally, motor vehicle dealership jobs fell 27,100 (-6.6% y/y), off at a 14.0% rate during the last three months. To the upside were jobs in the education & health industries, up 52,000 (3.0% y/y).
Construction sector employment fell by 82,000 (-7.6% y/y and at a 10.8% rate during the last three months.
Factory sector jobs fell another 85,000 (-4.5% y/y). Motor vehicle & parts jobs dropped 13,100 (-14.9% y/y) while furniture & parts jobs declined by 6,600 (-11.7% y/y. In the nondurables sector employment fell 23,000 (-3.0% y/y).
Government sector jobs moved higher again, last month by 7,000 (1.2% y/y). Local governments added 1,000 (1.0% y/y) workers and state governments added 6,000 (1.6% y/y). The number of federal government jobs was unchanged (1.6% y/y).
Comparing Current Payroll Employment Changes with Past Recessions from the Federal Reserve Bank of Cleveland is available here.
The length of the average workweek fell to 33.5 hours, down slightly from the 3Q average. That was the shortest workweek on record
Continuing to suggest continued declines in employment was the one month diffusion index, which measures the breadth of job gain or loss (50 is the break-even level). It fell to its lowest level of this cycle (27.6%). The three-month index also was at its cycle low at 27.0% and the three-month figure for the factory sector was even weaker at 20.2%.
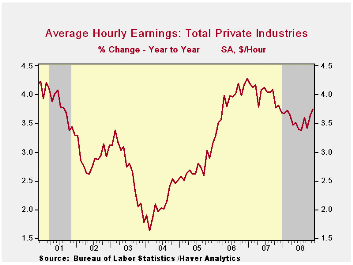
Average hourly earnings rose 0.4%. Earnings the factory sector rose 0.3% (3.0% y/y) and private services wages rose 0.4% (3.8% y/y). Figures prior to November were revised up.
| Employment: 000s | November | October | September | Y/Y | 2007 | 2006 | 2005 |
|---|---|---|---|---|---|---|---|
| Payroll Employment | -533 | -320 | -403 | -1.4% | 1.1% | 1.8% | 1.7% |
| Previous | -- | -240 | -244 | -- | 1.3% | 1.9% | 1.7% |
| Manufacturing | -85 | -104 | -69 | -4.5% | -1.9% | -0.5% | -0.6% |
| Construction | -82 | -64 | -55 | -7.6% | -1.0% | 4.9% | 5.2% |
| Service Producing | -370 | -153 | -286 | -0.6% | 1.6% | 1.8% | 1.8% |
| Average Weekly Hours | 33.5 | 33.6 | 33.6 | 33.8 (Nov. '07) | 33.8 | 33.9 | 33.8 |
| Average Hourly Earnings | 0.4% | 0.3% | 0.2% | 3.7% | 4.0% | 3.9% | 2.7% |
| Unemployment Rate | 6.7% | 6.5% | 6.1% | 4.7% (Nov. '07) | 4.6% | 4.6% | 5.1% |
by Robert Brsuca December 5, 2008
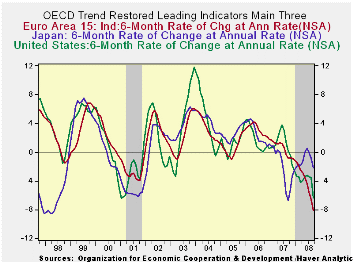
The LEIs from the OECD are plunging and the outlook is not for more severe slowdowns across the region and for many key members. The Euro Area and the US figures show the most rapid descent while Japan ’s index is going down for the second time in this ‘cycle’.
India , China and Russia are showing signs of increased pain. The Russian index is down especially sharply. This worldwide slowdown is clobbering all those countries that had been expected to be resilient. Russia is being hurt due to its status as a commodity currency, especially as an oil producer.
The drops in the US and European indices are as severe, or more severe, than in the last US business cycle.
| OECD Trend-Restored Leading Indicators | ||||
|---|---|---|---|---|
| Growth Progression-SAAR | ||||
| 3Mos | 6Mos | 12mos | Yr-Ago | |
| OECD | -9.2% | -6.7% | -3.8% | 1.6% |
| OECD 7 | -10.1% | -7.3% | -4.5% | 1.0% |
| OECD Europe | -9.1% | -7.4% | -4.5% | 1.7% |
| OECD Japan | -7.2% | -4.3% | -0.8% | -1.4% |
| OECD US | -11.4% | -7.7% | -5.3% | 1.4% |
| Six month readings at 6-Mo Intervals: | ||||
| Recent six | 6Mo Ago | 12Mo Ago | 18MO Ago | |
| OECD | -6.7% | -0.9% | 0.1% | 3.2% |
| OECD 7 | -7.3% | -1.6% | -0.5% | 2.5% |
| OECD Europe | -7.4% | -1.5% | 0.9% | 2.6% |
| OECD Japan | -4.3% | 2.8% | -3.5% | 0.6% |
| OECD US | -7.7% | -2.8% | -0.4% | 3.2% |
| Slowdowns indicated by BOLD RED. | ||||
by Robert Brsuca December 5, 2008
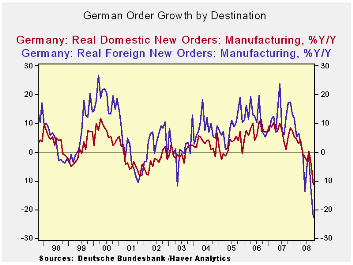
German new MFG orders dropped 6.1% in October from September. In September they fell 8.3% from August. The party is over.
Foreign orders are falling faster overall but in the month domestic orders almost caught up in pace with foreign weakness: compare -6.2% to -6.1%. In the new quarter domestic orders are falling at a 40.1% pace while foreign orders are falling at a 55.3% pace. Both are horrific numbers. Whatever skepticism Europeans have had about this slowdown or its ability to reach out and sting them too, those reservations should now be gone. Europe is being led lower by Germany and at a very rapid pace.
Sales in Germany are now all on negative trends for the quarter. Orders have been pared even more dramatically than sales reflecting the forward-looking creatures that they are. The economy is spiraling lower at a rapid pace. The ECB does have more room to cut rates than the Fed but we have seen that amounts to pushing on a string. The US is gearing up for more fiscal stimulus. Meanwhile, the last we heard from German Chancellor Merkel, she was against getting into a stimulus race. She may be right about that, but that is no excuse not to ‘run’ at all.
| German Orders and Sales By Sector and Origin | ||||||||
|---|---|---|---|---|---|---|---|---|
| Real and SA | % M/M | % Saar | ||||||
| Oct-08 | Sep-08 | Aug-08 | 3-MO | 6-Mo | 12-Mo | Yr Ago | QTR-2-Date | |
| Total Orders | -6.1% | -8.3% | 3.5% | -36.8% | -20.5% | -17.3% | 11.2% | -48.2% |
| Foreign | -6.2% | -11.6% | 4.3% | -44.3% | -25.4% | -22.7% | 17.0% | -55.3% |
| Domestic | -6.1% | -4.7% | 2.8% | -28.2% | -15.2% | -11.3% | 5.2% | -40.1% |
| Real Sector Sales | ||||||||
| MFG/Mining | -0.2% | -4.3% | 4.5% | -0.7% | -0.3% | -3.4% | 6.9% | -9.4% |
| Consumer | -0.1% | -1.2% | 2.0% | 2.8% | 1.4% | -3.5% | 2.3% | -1.4% |
| Consumer Durables | -0.6% | -6.2% | 6.8% | -1.7% | -0.9% | -4.9% | -0.2% | -15.2% |
| Consumer Non-Durable | 0.0% | -0.2% | 1.2% | 4.0% | 2.0% | -3.3% | 2.9% | 1.6% |
| Capital Goods | 0.7% | -5.4% | 5.7% | 2.8% | 1.4% | -3.3% | 9.7% | -7.0% |
| Intermediate Goods | -1.2% | -4.5% | 4.2% | -6.4% | -3.3% | -3.2% | 6.1% | -15.9% |
| All MFG-Sales | -0.1% | -4.2% | 4.4% | -0.3% | -0.2% | -3.3% | 6.4% | -8.8% |
by Tom Moeller December 5, 2008
 The
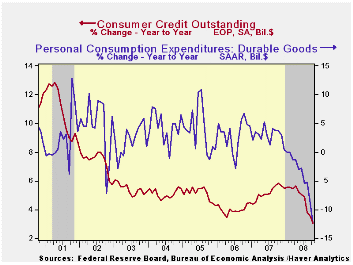
usage of consumer credit continued to fall as it never has before.
During October, consumer credit outstanding fell $3.6 billion m/m.
Though that lagged a $6.5B decline back in August, it still was one of
the largest in the series' postwar history. On a percentage basis,
credit outstanding over the last three months fell 0.1%, the first
decline since 1992.
The
usage of consumer credit continued to fall as it never has before.
During October, consumer credit outstanding fell $3.6 billion m/m.
Though that lagged a $6.5B decline back in August, it still was one of
the largest in the series' postwar history. On a percentage basis,
credit outstanding over the last three months fell 0.1%, the first
decline since 1992.
Before October, credit growth averaged roughly 5% y/y after the rise of 5.5% during all of 2007. The decline in y/y growth thru October to 3.1% was precipitated by less spending on consumer durables. The annualized growth in nominal PCE for durable goods during the last three months cycled down to -22.4% from 2.9% positive growth during all of last year.
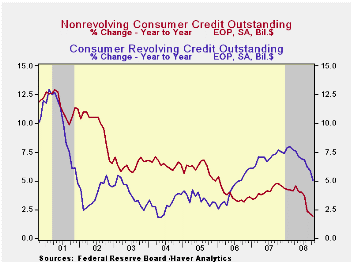
Non-revolving credit, which accounts for nearly two-thirds of total consumer credit, led the October decline in borrowing with a $3.4B drop. The dollar drop was nearly unprecedented. On a three month basis, annualized growth fell to -1.9% after a 4.4% rise last year and 3.6% growth during 2006.
Revolving credit outstanding dropped a more modest $0.2B during October. Indeed, consumers were much more frugal using their credit cards. Three month growth fell to 1.8%, down by more than two thirds from the 7.4% growth last year.
These figures are the major input to the Fed's quarterly Flow of Funds accounts for the household sector. For 4Q08 the data will be released later this month.
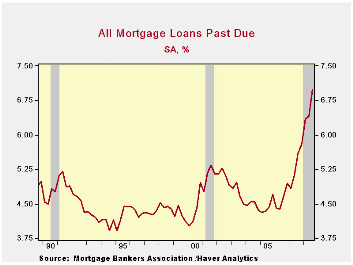
These data are available in Haver's USECON database.Delinquent Home Mortgages Up Sharply· For the third quarter, 7% of all mortgages were past due. The increase in lagged payments was up from 6.4% of loans during 2Q, 5.8% last year and 5.0% in 2006. Past due by 30 days were 3.4% of loans versus 3.2% last year and 2.2% were past due by 90 days versus 1.5% during 2007.
Foreclosures were started on 1.1% of loans, down from 1.2% in 2Q. The latest still was up, however, from 0.8% in 3Q of last year and from 0.5% in 3Q06. During all of last year, 2.8% of all mortgage loans went into foreclosure, a record high and up from a norm of 0.2% to 0.4%.
Of conventional prime fixed rate mortgages 3.4% were past due, up from 2.6% last year. The news on ARMs, however, is far worse. The estimate is that 8.2% were delinquent versus 5.5% last year and 3.4% in 2006.
These data are available in Haver's MBAMTG database.
| Consumer Credit (m/m Chg, SAAR) | October | September | Y/Y | 2007 | 2006 | 2005 |
|---|---|---|---|---|---|---|
| Total | $-3.6B | $6.8B | 3.1% | 5.5% | 4.5% | 4.3% |
| Revolving | $-0.2B | $2.5B | 5.0% | 7.4% | 6.1% | 3.1% |
| Non-revolving | $-3.4B | $4.2B | 1.9% | 4.4% | 3.6% | 4.9% |

Tom Moeller
AuthorMore in Author Profile »Prior to joining Haver Analytics in 2000, Mr. Moeller worked as the Economist at Chancellor Capital Management from 1985 to 1999. There, he developed comprehensive economic forecasts and interpreted economic data for equity and fixed income portfolio managers. Also at Chancellor, Mr. Moeller worked as an equity analyst and was responsible for researching and rating companies in the economically sensitive automobile and housing industries for investment in Chancellor’s equity portfolio. Prior to joining Chancellor, Mr. Moeller was an Economist at Citibank from 1979 to 1984. He also analyzed pricing behavior in the metals industry for the Council on Wage and Price Stability in Washington, D.C. In 1999, Mr. Moeller received the award for most accurate forecast from the Forecasters' Club of New York. From 1990 to 1992 he was President of the New York Association for Business Economists. Mr. Moeller earned an M.B.A. in Finance from Fordham University, where he graduated in 1987. He holds a Bachelor of Arts in Economics from George Washington University.
More Economy in Brief


