 Global| Sep 01 2006
U.S. Payrolls On Target
by:Tom Moeller
|in:Economy in Brief
Summary
In August, nonfarm payrolls rose 128,000 and about matched Consensus expectations for a 125,000 gain. For the prior month, the increase was upwardly revised up slightly to 121,000. Year to date payrolls have risen an average 141,000 [...]
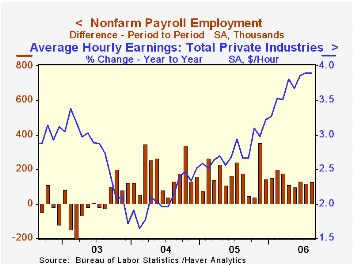
In August, nonfarm payrolls rose 128,000 and about matched Consensus expectations for a 125,000 gain. For the prior month, the increase was upwardly revised up slightly to 121,000.
Year to date payrolls have risen an average 141,000 per month versus an average gain of 165,000 last year and an average 175,000 during 2004.
From the household survey the unemployment rate fell back to 4.7%, as expected, from 4.8%. Employment grew 250,000 (1.5% y/y) after the prior month's 34,000 worker decline. The labor force rose 164,000 (1.3% y/y) and the labor force participation rate remained up at 66.2% for the third straight month.
The breadth of one month gain in private payrolls rose slightly to 55.9% in August, though that remained below the April high of 64.4%. In the factory sector the one month breadth of gain fell to a less-than break even 44.6%.
Factory sector payrolls fell 11,000 for fifth the m/m decline this year. Jobs in the motor vehicle & parts industries fell 6,900 (-2.3% y/y) while furniture & related industry jobs also fell by 4,200 (-2.8% y/y). A 3,000 (-0.9% y/y) worker decline in nondurable goods payrolls was broad based but led by a 2,100 (-3.9% y/y) drop in apparel employment and a 3,000 worker (-1.4% y/y) drop in plastics.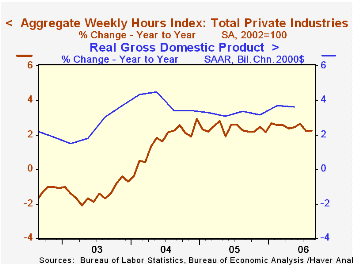
Private service-producing jobs rose 101,000 (1.4% y/y) though retail trade sector jobs continued weak fell another 13,500 (-0.7% y/y). Financial sector jobs offset some of that decline with a 10,000 (2.2% y/y) gain and professional & business services employment rose 26,000 (2.7% y/y). Temporary help services jobs rose 3,400 (2.8% y/y) while jobs in education & health services grew 60,000 (2.2% y/y).Government sector jobs grew 17,000 (0.6% y/y).
Construction employment rose 17,000 (2.9% y/y) though the number of jobs in nonresidential construction slipped 1,600 (4.1% y/y).
Average hourly earnings rose just 0.1% after two months of 0.4% & 0.5% increase, and fell short of expectations for a 0.3% rise. The increase in factory sector earnings also rose just 0.1% (1.0% y/y).
The workweek slipped and lowered the index of aggregate weekly hours worked in private industries by 0.2% after a modest 0.1% July gain. During 3Q the average level of the index is up 0.8% (AR) after a 2.6% gain during 2Q. During the last ten years there has been an 81% correlation between the y/y change in aggregate hours worked and real GDP growth.
| Employment | August | July | Y/Y | 2005 | 2004 | 2003 |
|---|---|---|---|---|---|---|
| Payroll Employment | 128,000 | 121,000 | 1.3% | 1.5% | 1.1% | -0.3% |
| Manufacturing | -11,000 | -23,000 | 0.1% | -0.6% | -1.3% | -4.9% |
| Average Weekly Hours | 33.8 | 33.9 | 33.7 (August '05) | 33.8 | 33.7 | 33.7 |
| Average Hourly Earnings | 0.1% | 0.5% | 3.9% | 2.8% | 2.1% | 2.7% |
| Unemployment Rate | 4.7% | 4.8% | 4.9% (August '05) | 5.1% | 5.5% | 6.0% |
by Tom Moeller September 1, 2006
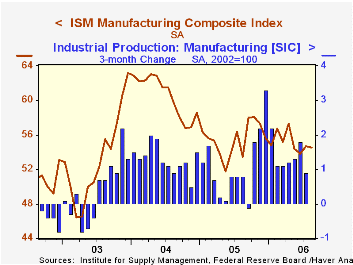
At 54.5, the August composite index of manufacturing sector activity from the Institute for Supply Management was about stable with the July figure of 54.7. Consensus expectations had been for a reading of 54.9.
During the last ten years there has been a 67% correlation between the ISM index and three month growth in factory sector industrial production.
A decline in the new orders index to 54.2 was offset by a rise in employment which at 54.0 was at the highest level since April.
During the last twenty years there has been a 66% correlation between the level of the ISM employment Index and the three month growth in factory sector employment.
The production index slipped to 56.6 from 57.6 in July while the vendor deliveries (55.0) and the inventory (50.2) indexes were about stable.
The price index dropped to 73.0, its lowest level since April. During the last twenty years there has been a 91% correlation between the price index and the three month change in the PPI for intermediate goods less food & energy.
| ISM Manufacturing Survey | August | July | August '05 | 2005 | 2004 | 2003 |
|---|---|---|---|---|---|---|
| Composite Index | 54.5 | 54.7 | 53.5 | 55.5 | 60.5 | 53.3 |
| Prices Index (NSA) | 73.0 | 78.5 | 62.5 | 66.4 | 79.8 | 59.6 |
by Tom Moeller September 1, 2006
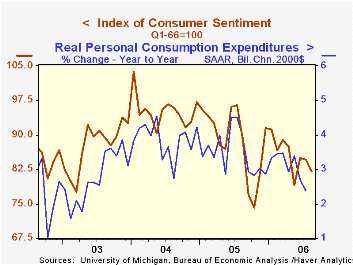
Consumer sentiment in late August firmed enough to limit the m/m decline for the full month to 3.2%, according to the University of Michigan. The full month reading of 82.0 compared favorably to Consensus expectations for a decline to 79.0.
During the last ten years there has been a 77% correlation between the level of consumer sentiment and the y/y change in real consumer spending and during those ten years sentiment has a 68% correlation with the change in nonfarm payrolls.
Expectations for the economy slipped 6.2% m/m. Expected 12 month business conditions and the expected change in personal finances fell sharply to the lowest levels since November.
The reading of current economic conditions rose modestly m/m by 0.3%. The current read of personal finances slipped but perceived buying conditions for large household goods rose.
Consumers' opinion about gov't economic policy was unchanged m/m (-3.5% y/y) after sharp improvement during July. Expected inflation during the next year surged m/m to 4.6%, its highest level since May. The five to ten year expected rate of inflation also rose to 3.5%, its highest since May.
The University of Michigan survey is not seasonally adjusted.The mid-month survey is based on telephone interviews with 250 households nationwide on personal finances and business and buying conditions. The survey is expanded to a total of 500 interviews at month end.
| University of Michigan | August (Final) | August (Prelim) | July | Y/Y | 2005 | 2004 | 2003 |
|---|---|---|---|---|---|---|---|
| Consumer Sentiment | 82.0 | 78.7 | 84.7 | -8.0% | 88.6 | 95.2 | 87.6 |
| Current Conditions | 103.8 | 100.8 | 103.5 | -4.1% | 105.9 | 105.6 | 97.2 |
| Expectations | 68.0 | 64.5 | 72.5 | -11.6% | 77.4 | 88.5 | 81.4 |
by Carol Stone September 1, 2006
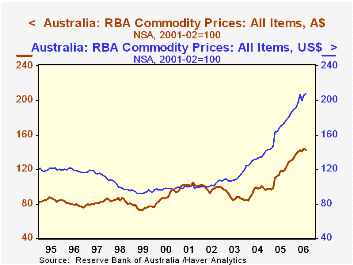
The Reserve Bank of Australia reported today its commodity price index for August. The overall index fell 0.8% from July in Australian dollar terms and rose 0.7% in US dollars. From a year ago, the A$ total is up 20.7%, and 20.8% in US$.
Within the Aussie dollar measure, agricultural, or "rural" commodities, fell 3.4% in August but are 14.5% ahead of August 2005. Generally, those items, which include a variety of farm products such as beef, wheat and cotton, have been falling over the last three years. Non-farm products, however, have had strong prices, with gains of nearly 23% in 2004 and 43% in 2005; the August figure is showing signs of slowing, with a decline from July of 0.1%, helping to bring the year-on-year figure down to 22.2%.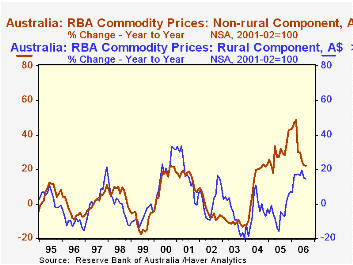
However, within the non-farm category metals prices have risen even more substantially in most of the last several months. The recent boom in metals prices is worldwide, and Australia has participated. In August, so-called "base metals" were up 2.2%, following 7.1% in July. June's prices fell, but that came after double-digit leaps in each April and May that totaled 27.8%. This component is up a whopping 76.2% from August 2005. The items in this index are copper, aluminum, nickel, zinc and lead.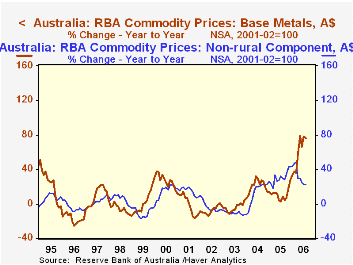
Most central banks don't calculate their own price indexes. Statistics bureaus tend to do that or, often for commodities, private market sources do it. We were aware that commodities are important to the Australian economy, and in browsing the Reserve Bank's website, we learned that exports constitute about 20% of that nation's national income and that "primary commodities" are a sizable portion of exports. So the central bank's interest in these raw materials prices is substantive regarding their effect on inflation, terms of trade and the health of the real economy. Exchange rate differentials are seen to have a quite noticeable impact on the movement of the price index, particularly with many of these items priced in US$ in world markets.
| Australia | Aug 2006 | July 2006 | June 2006 | Aug 2005 | 2005 | 2004 | 2003 |
|---|---|---|---|---|---|---|---|
| Commodity Price Index, A$ | 142.5 | 143.6 | 141.0 | 118.1 | 113.8 | 94.4 | 88.8 |
| % Change | -0.8 | 1.8 | -0.7 | 20.7 | 20.6 | 6.3 | -9.8 |
| Commodity Price Index, US$ | 207.7 | 206.2 | 199.5 | 171.9 | 165.6 | 132.6 | 110.3 |
| % Change | 0.7 | 3.4 | -3.7 | 20.8 | 24.8 | 20.2 | 7.9 |
| Rural Commodities, A$ | 96.5 | 99.9 | 98.4 | 84.3 | 87.0 | 91.4 | 96.1 |
| % Change | -3.4 | 1.5 | 0.8 | 14.5 | -4.9 | -4.8 | -7.5 |
| Non-Rural Commodities, A$ | 161.3 | 161.5 | 158.5 | 132.0 | 124.8 | 95.6 | 85.8 |
| % Change | -0.1 | 1.9 | -1.1 | 22.2 | 30.5 | 11.4 | -10.7 |
| Of which: Base Metals, A$ | 219.5 | 214.8 | 200.6 | 124.6 | 125.3 | 122.7 | 93.8 |
| % Change | 2.2 | 7.1 | -6.9 | 76.2 | 11.2 | 20.1 | -4.6 |

Tom Moeller
AuthorMore in Author Profile »Prior to joining Haver Analytics in 2000, Mr. Moeller worked as the Economist at Chancellor Capital Management from 1985 to 1999. There, he developed comprehensive economic forecasts and interpreted economic data for equity and fixed income portfolio managers. Also at Chancellor, Mr. Moeller worked as an equity analyst and was responsible for researching and rating companies in the economically sensitive automobile and housing industries for investment in Chancellor’s equity portfolio. Prior to joining Chancellor, Mr. Moeller was an Economist at Citibank from 1979 to 1984. He also analyzed pricing behavior in the metals industry for the Council on Wage and Price Stability in Washington, D.C. In 1999, Mr. Moeller received the award for most accurate forecast from the Forecasters' Club of New York. From 1990 to 1992 he was President of the New York Association for Business Economists. Mr. Moeller earned an M.B.A. in Finance from Fordham University, where he graduated in 1987. He holds a Bachelor of Arts in Economics from George Washington University.
More Economy in Brief


