 Global| Mar 25 2009
U.S. New Home Sales Step Up From Record Low
by:Tom Moeller
|in:Economy in Brief
Summary
February sales of new single-family homes ticked up off their lowest level in the series' history. Their 4.7% month-to-month rebound to 337,000 units, nevertheless, left them down by roughly three-quarters from their peak during July [...]
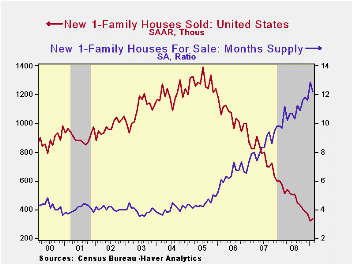
February sales of new single-family homes ticked up off their lowest level in the series' history. Their 4.7% month-to-month rebound to 337,000 units, nevertheless, left them down by roughly three-quarters from their peak during July 2005. February sales exceeded Consensus expectations for 300,000 units.
The February rebound in home sales was not broad based and limited to moderate increases in the South and the West. Home sales in the Midwest and in the Northeast continued lower.
Reflecting sales weakness was another decline in the median price for a new single-family home. At $200,900, the figure was off 11.6% during just the last two months and by nearly 20% since last year as homebuilders attempted to move inventory. Since their peak early in 2007, new home prices have fallen by roughly one quarter.
In fact, that effort to move homes continued successful and the inventory of unsold homes is down by 43% since the peak during 2006. In each of the country's regions, the inventory is down by one-quarter to one-third just during the last year.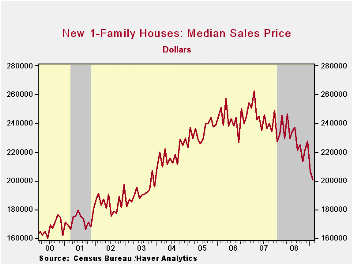
Despite the declines in inventory levels, the month's supply of new homes for sale remains high due to low sales. It ticked down just slightly during February from the record high to 12.2 months.
By range there have no sales of new homes priced over $750,000 during the last three months. There were 1,000 registered sales of a homes priced between $500,000 & $750,000 and 2,000 sales of homes priced between $400,000 and $500,000. These figures compare to sales between 3,000 and 8,000 of homes in the ranges below $400,000.
The new home sales figures are available in Haver's USECON database.
Today's House testimony by Fed Governor Elizabeth A. Duke titled Credit availability and prudent lending standards can be found here
| US New Homes | February | January | Y/Y (%) | 2008 | 2007 | 2006 |
|---|---|---|---|---|---|---|
| Total Sales (SAAR, 000s) | 337 | 332 | -41.1 | 479 | 768 | 1,049 |
| Northeast | 29 | 30 | -25.6 | 35 | 64 | 64 |
| Midwest | 50 | 55 | -35.1 | 69 | 118 | 161 |
| South | 193 | 176 | -38.5 | 264 | 408 | 559 |
| West | 65 | 61 | -54.2 | 111 | 178 | 266 |
| Median Price (NSA, $) | 200,900 | 206,800 | -18.1 | 230,217 | 243,742 | 243,067 |

Tom Moeller
AuthorMore in Author Profile »Prior to joining Haver Analytics in 2000, Mr. Moeller worked as the Economist at Chancellor Capital Management from 1985 to 1999. There, he developed comprehensive economic forecasts and interpreted economic data for equity and fixed income portfolio managers. Also at Chancellor, Mr. Moeller worked as an equity analyst and was responsible for researching and rating companies in the economically sensitive automobile and housing industries for investment in Chancellor’s equity portfolio. Prior to joining Chancellor, Mr. Moeller was an Economist at Citibank from 1979 to 1984. He also analyzed pricing behavior in the metals industry for the Council on Wage and Price Stability in Washington, D.C. In 1999, Mr. Moeller received the award for most accurate forecast from the Forecasters' Club of New York. From 1990 to 1992 he was President of the New York Association for Business Economists. Mr. Moeller earned an M.B.A. in Finance from Fordham University, where he graduated in 1987. He holds a Bachelor of Arts in Economics from George Washington University.
More Economy in Brief


