 Global| Apr 20 2009
U.S. Leading Indicators Fall To The Lowest Level Since 2003
by:Tom Moeller
|in:Economy in Brief
Summary
The Conference Board reported that the March composite index of leading economic indicators fell 0.3% to the lowest level since early-2003. The decline in the February index was revised to a shortfall of 0.2%. Foreshadowing the [...]
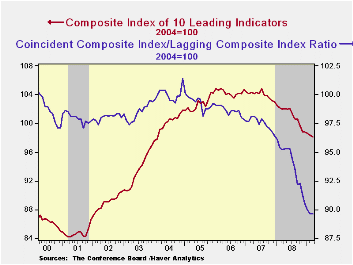
The Conference Board reported that the March composite index of leading economic indicators fell 0.3% to the lowest level since early-2003. The decline in the February index was revised to a shortfall of 0.2%. Foreshadowing the current recession, the index has been moving steadily lower since a 2007 peak.
Six of the ten components of the leading index fell last month including sharp declines in the length of the workweek, stock prices and building permits while initial unemployment insurance claims jumped.
The breadth of one-month increase amongst the leaders' 10 components fell back to 35% and over a six-month period the breadth of gain amongst the components remained minimal at just 20%.
The leading index is based on actual reports for eight economic data series. The Conference Board initially estimates two series, orders for consumer goods and orders for capital goods.
Continuing to reflect economic recession, the coincident
indicators fell another 0.4% and they are off 4.9% during the last
year. Half of the four component series fell during March with outsized
declines registered by employment and production. Over the last ten
years there has been a 76% correlation between this y/y change and real
GDP.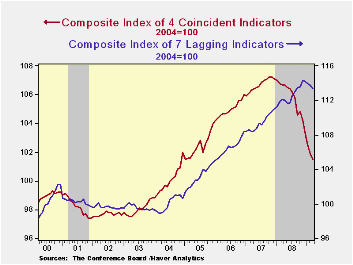
The lagging index fell 0.4% after a 0.3% February decline. The ratio of coincident-to-lagging indicators (a measure of economic excess) remained stable at its lowest level since 1975.
The Conference Board figures are available in Haver's BCI database. Visit the Conference Board's site for coverage of leading indicator series from around the world.
Financial Innovation and Consumer Protection is Friday's speech by Fed Chairman Ben S. Bernanke and it is available here.
Monetary Policy in the Financial Crisis is Saturday's speech by Fed Vice Chairman Donald L. Cohn and it can be found here.
| Business Cycle Indicators (%) | March | February | January | Dec. 6-Month % (AR) | 2008 | 2007 | 2006 |
|---|---|---|---|---|---|---|---|
| Leading | -0.3 | -0.2 | -0.2 | -4.9 | -2.8 | -0.3 | 1.5 |
| Coincident | -0.4 | -0.6 | -0.9 | -5.8 | -0.8 | 1.6 | 2.5 |
| Lagging | -0.4 | -0.3 | -0.2 | -0.4 | 2.9 | 2.8 | 3.3 |
by Tom Moeller April 20, 2009
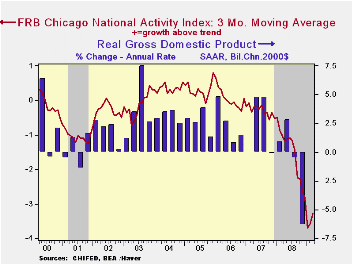
The March National Activity Index (CFNAI) from the Chicago Federal Reserve Bank remained negative last month. At -2.96 the figure was roughly stable with February but both figures were up marginally from the low reading of -4.03 reached in January. Since 1970 there has been a 74% correlation between the level of the index and the q/q change in real GDP.
The three-month moving average of the index ticked up slightly to -3.27 but remained near its lowest since January of 1975.
An index level at or below -0.70 typically has indicated negative U.S. economic growth. A zero value of the CFNAI indicates that the economy is expanding at its historical trend rate of growth of roughly 3%.
The complete CFNAI report is available here and the historical data are available in Haver's SURVEYS database.
The employment, production and income components made large negative contributions to the March index. Thirteen of the index's component sectors had a negative influence while 72 had a negative influence.
The CFNAI is a weighted average of 85 indicators of economic activity. The indicators reflect activity in the following categories: production & income, the labor market, personal consumption & housing, manufacturing & trade sales, and inventories & orders.
In a separate survey, the Chicago Fed indicated that its Midwest manufacturing index fell during February to its lowest level since 1994. Indicators for the steel and machinery sectors each fell but the measure for the auto sector rose while the resource sector was unchanged.
The Chicago Federal Reserve figures are available in Haver's SURVEYS database.
| Chicago Fed | March | February | March '08 | 2008 | 2007 | 2006 |
|---|---|---|---|---|---|---|
| CFNAI | -2.96 | -2.82 | -1.14 | -1.79 | -0.37 | 0.03 |
| 3-Month Average | -3.27 | -3.57 | -3.69 | -- | -- | -- |
by Robert Brusca April 20, 2009
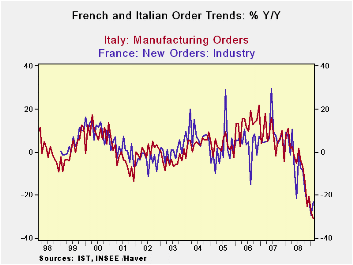
European orders are still on bad trends. But France is showing some life in February. As life signs go it’s still a weak vital sign despite its apparent vigor. Orders did jump by 5.2% in nominal terms in February, just one month after falling by 2.1%. But orders are still down by 23% over 12 months as the annual rate over three months has shot up to a positive 4.3%, a rare positive three-month reading in the e-zone. Still, the accompanying chart puts the French figures in context. The French Yr/Yr drop had been much worse than the similar decline in Italy since about may of 2008. With the large bump up in orders for France in February, France ’s Yr/Yr decline has braked and left Italy with the weaker trend, but this is nothing unprecedented.
For France the order revival is a domestic affair as foreign orders continued to fall by 0.6% in February, a drop but one with less vigor. Still the 5.2% rise in orders speaks of a sharp rebound domestically, possibly following the striking activity in France . So I’d be wary of reading much into it.
Compared to Italy , French foreign order growth has been much weaker over the last three months. Of course, one reason might be that Italy ’s ‘foreign’ orders have benefited from some uptick in domestic activity in France this month. By comparison, French exports have had no such favor in Italy , where the domestic economy is still struggling. Apart from that the two nations face a similar array of trading partners but with their own specific concentrations of trade, of course. Both countries show ongoing weakness in sales or in industrial output at home. As I said above, there is not much to sink your teeth into, if you are an optimist, despite the rise in French orders this month. Given the performance in the rest of Europe, especially Germany , and given the way the persisting French strikes have wracked the French economy, I’d be wary to read much into this rebound in French orders in February.
| Italy Orders | ||||||
|---|---|---|---|---|---|---|
| Saar except m/m | Feb-09 | Jan-09 | Dec-08 | 3-month | 6-month | 12-month |
| Total | -1.5% | -3.9% | -2.1% | -26.2% | -39.3% | -31.0% |
| Foreign | 3.5% | -3.0% | -2.1% | -7.2% | -37.6% | -30.2% |
| Domestic | -4.1% | -4.4% | -2.0% | -34.8% | -40.3% | -31.5% |
| Memo: | ||||||
| Sales | -3.1% | -4.0% | -3.3% | -34.6% | -33.1% | -23.0% |
| French Orders | ||||||
| Saar except m/m | Feb-09 | Jan-09 | Dec-08 | 3-month | 6-month | 12-month |
| Total | 5.2% | -2.1% | -1.9% | 4.3% | -30.8% | -23.3% |
| Foreign | -0.6% | -11.5% | 0.0% | -40.1% | -44.0% | -37.7% |
| IP ex Construction | -0.1% | -5.0% | -2.3% | -25.8% | -28.0% | -17.8% |

Tom Moeller
AuthorMore in Author Profile »Prior to joining Haver Analytics in 2000, Mr. Moeller worked as the Economist at Chancellor Capital Management from 1985 to 1999. There, he developed comprehensive economic forecasts and interpreted economic data for equity and fixed income portfolio managers. Also at Chancellor, Mr. Moeller worked as an equity analyst and was responsible for researching and rating companies in the economically sensitive automobile and housing industries for investment in Chancellor’s equity portfolio. Prior to joining Chancellor, Mr. Moeller was an Economist at Citibank from 1979 to 1984. He also analyzed pricing behavior in the metals industry for the Council on Wage and Price Stability in Washington, D.C. In 1999, Mr. Moeller received the award for most accurate forecast from the Forecasters' Club of New York. From 1990 to 1992 he was President of the New York Association for Business Economists. Mr. Moeller earned an M.B.A. in Finance from Fordham University, where he graduated in 1987. He holds a Bachelor of Arts in Economics from George Washington University.
More Economy in Brief


