 Global| Jan 22 2010
U.S. Leading Economic IndicatorsSuggest Continued Recovery
by:Tom Moeller
|in:Economy in Brief
Summary
The firm uptrend in the Conference Board's Index of Leading Economic Indicators continued last month with a rise of 1.1% following an upwardly revised like gain in November. It was the ninth consecutive monthly increase and the 10.8% [...]
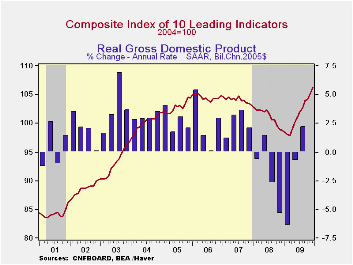
The firm uptrend in the Conference Board's Index of Leading Economic Indicators continued last month with a rise of 1.1% following an upwardly revised like gain in November. It was the ninth consecutive monthly increase and the 10.8% (centered) rate of increase during the last six months remained nearly the strongest since early-1983. The leading index is based on actual reports for eight economic data series. The Conference Board initially estimates two series, consumer and capital goods orders.
The leaders' increase supports widespread forecasts for a 4.5% (AR) gain in 4Q 2009 real GDP. The preliminary figures will be released this coming Friday.
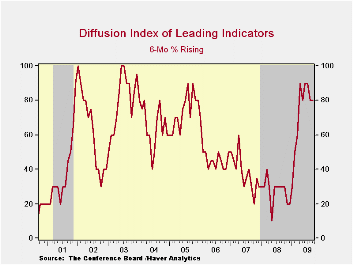
The breadth of increase amongst the component series improved last month back to the strongest percentage of the cycle. Nine out of the ten components rose during December versus 70% during the prior two months. During the most recent six months, however, just 80% of the series rose. Prominent in last month's increase was a steeper interest rate yield curve, higher building permits and lower initial claims for unemployment insurance.
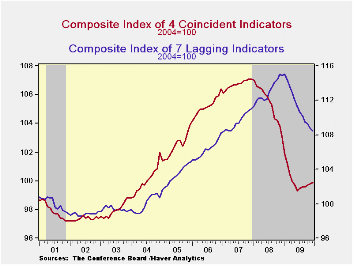
Continuing to suggest economic improvement was the coincident indicator series which rose for the fifth month in the last six. The 0.1% December gain followed a 0.1% November increase that was revised down slightly. During the last six months the 1.2% rate of increase in the coincident series compares to a -7.9% reading at its worst in January. Increases in industrial production, real personal income and business sales have been modest but compare to sharp declines late in 2008. Declines in payroll employment also have eased considerably.
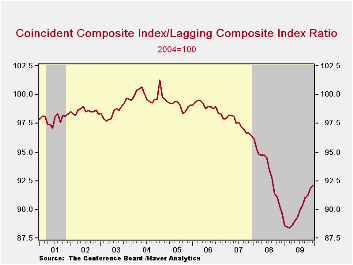
In a continued sign that excesses in the U.S. economy are still falling, the lagging index has been falling since January. Leading the decline have been lower commercial & industrial loans outstanding, slower growth in labor costs, less consumer credit and slower service price inflation. The ratio of coincident-to-lagging indicators (another leading indicator) also continued higher for the ninth straight month to the highest level since August of 2008.
The Conference Board figures are available in Haver's BCI database. Visit the Conference Board's site for coverage of leading indicator series from around the world. The latest U.S. Leading Indicators release can be found here here.
| Business Cycle Indicators (%) | December | November | October | Sept. 6-Month % (AR) | 2009 | 2008 | 2007 |
|---|---|---|---|---|---|---|---|
| Leading | 1.1 | 1.0 | 0.3 | 10.8 | 0.4 | -2.8 | -0.4 |
| Coincident | 0.1 | 0.1 | 0.1 | 1.2 | -5.1 | -1.2 | 1.4 |
| Lagging | -0.2 | -0.5 | -0.2 | -4.8 | -1.6 | 3.2 | 3.0 |
by Robert Brusca January 22, 2010
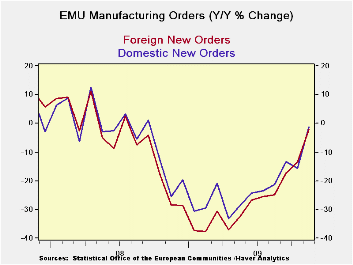
EMU orders rise,
but beware the optimism
EMU orders rose in November more than expected. A lot is being made of
the much smaller Yr/Yr drop which now at -4.1% compares to the -12.1%
reported last month (not shown in the table). But this arithmetic is
tricky. As you can see this rise in orders in November was a relatively
modest +0.6%, while the difference in the Yr/Yr drop is a massive eight
percentage points. It’s because in November of 2008 orders had been
dropping very rapidly. Orders AVERAGED month-to-month drops of 6.8% in
Sept, Oct, and November of 2008. In December of 2008 orders then
plunged m/m by 10.9%! The upcoming Dec orders figure will be
delightful, as, if the level of orders is unchanged in Dec 2009, the
Yr/Yr orders figure will jump by 7.6% Yr/Yr. But that outcome would not
really signal any change in the pace of recovery, would it?
Perspective
We include in the table a column to remind you how much these various
series are off from their cycle peaks EVEN if that peak was more than
one year ago. Currently sales are off by 20% from their peak. Orders
are off by 23.6% from their peak. Orders in Germany, France, Italy and
the UK are also clustered around a peak-to-current drop of about 30%
(see table for hairsplitting).
No MFG sector
tooth-fairy
The point is that yes, there is some rebound in train, but that
industry has not made some magical recovery as if visited overnight (or
over-month) by the tooth-fairy. The industrial sector remains severely
impacted by the recession and is still very much in dig-out mode even
though the yr/yr figures will turn to a sharp positive reading in
December. For now e-zone sales are up from their cycle’s lowest point
by only 3.8%. Orders are up from their cycle lowest point by 10.9%. At
that foreign orders are leading the rebound with a rise of 12.7% from
their low compared to a rise of 9.3% by domestic orders form their low.
Germany at +19% from its low is showing the most rapid recovery –even
if its drop from its peak is now only about the same as elsewhere in
EU/EMU. While France at +2% is experiencing the smallest bounced from
its cycle low.
Growth, ‘yes’
but acceleration, ‘no’
Momentum is still building to the upside but it is not
accelerating. The three-month growth rate of orders is less than the
rate over six months (both annualized, of course). Over three-months
France and the UK have seen drops in orders and that is not good, but
it’s not decisive either. . Trichet’s warning that recovery would be
moderate and somewhat irregular is a simple statement of extrapolating
what is already in train: the gospel from the church of what’s
happening now.
Upbeat
interpretation is exaggerated
So despite the upbeat tone on the orders report of today, if we put the
data in context, it’s a slow plodding and irregular recovery in Europe.
Recovery is not gaining momentum despite the month’s result on orders
growth and despite yr/yr improvement in orders. We are more interested
in yr/yr results that are driven by changes in the front month than by
those driven by the back month which is the case in November and likely
will be the case in the December.
The Obama Plan
meets world opinion and reality
The recent reports from the e-Zone have become more circumspect. The UK
reported out some poor December retail sales results today (Friday, Jan
22). Japan hit a 21-year low in supermarket sales. President Obama’s
plan to corral unruly bank practices has sent a pall across the
financial sector and has bushwhacked stocks around the globe. It is
clear that a lot of work still lies ahead for the world’s key economies
if they are to get recovery in full swing. Attempts to set a new fairer
path for financial institutions may slow down this already slow
recovery. To make matters worse the noises from around the world’s
policy circles show a lot of disagreement over what President Obama has
announced even among those who like it ‘in principle.’ So, are we
doomed to an even weaker recovery?
A rational view
of irrationality
I urge a different message be distilled from this reluctance by banks
and bankers to modify their post-crisis behavior. Many see it as greed
and simply foment anger about it. I urge that bankers’ behavior be seen
in a broader context. Look at how reluctant bankers are to change even
with all their troubles and failings that were obviously of their own
doing. They do not want to change behavior or alter their
bonus-getting… why do economists assume that consumers will be so much
more wiling to make changes; to save more and to spend less? It seems
to me that the key to recovery is to get jobs growth going. Once it is
in gear I would expect consumers to spend as they always have. For
those newly back to work the urge to spend will be strong (pent up
demand). Discipline will flag among those who are now thrifty as the
crisis passes and as fear erodes.
Behavior is
behavior is behavior…
Behavior is hard to change and not just for bankers. Try to stop
smoking; try to lose weight; just TRY to stop spending. It is harder to
change when one does not learn from his own lesson; as bankers have not
learned as they were bailed out. Consumers have been put on a
starvation diet by taking their jobs and destroying their wealth. They
have not modified their behavior out of choice – something economists
don’t; yet seem to appreciate. They long to go back to their old
spending ways. And the wheels of change are spinning. I think the
potential of the up-swing is being under-valued for these reasons even
with all the obvious problems faced by the world’s economies. Behavior
is the hardest thing of all to change even if it is not rational
(smoking, overeating, overspending). Give consumers jobs and let them
earn income and they will go back to the ‘old normal’. Forget this
stuff about a ‘new normal’ that is more austere; it’s a positively
abnormal thought.
| Euro-Area and UK Industrial Orders & Sales Trends | ||||||||||
|---|---|---|---|---|---|---|---|---|---|---|
| Saar except m/m |
% m/m | Nov 09 |
Nov 09 |
Nov 09 |
Nov 08 |
Nov 07 |
Qtr -2- Date |
From 2Y |
||
| Euro-Area Detail | Nov 09 |
Oct 09 |
Sep 09 |
3Mo | 6mo | 12mo | 12mo | 12mo | Saar | max |
| MFG Sales | 0.6% | 0.4% | -0.8% | 1.1% | 6.0% | -10.0% | -7.1% | 4.8% | 4.4% | -20.6% |
| Intermediate | 1.0% | -6.7% | 6.6% | 1.8% | 19.4% | -1.2% | -6.2% | 4.6% | 12.2% | -29.4% |
| MFG Orders | ||||||||||
| Total Orders | 1.6% | -1.9% | 1.6% | 5.0% | 19.3% | -4.1% | -23.4% | 9.8% | 0.3% | -26.5% |
| E-13 Domestic MFG orders | 1.0% | -6.7% | 6.6% | 1.8% | 19.4% | -1.2% | -25.5% | 8.8% | -14.6% | -29.4% |
| E-13 Foreign MFG orders | 0.6% | -2.2% | 7.1% | 23.8% | 26.7% | -2.1% | -28.3% | 11.0% | 4.7% | -30.6% |
| Countries: | Nov 09 |
Oct 09 |
Sep 09 |
3Mo | 6mo | 12mo | 12mo | 12mo | Qtr-2 Date |
|
| Germany: | 3.2% | -2.3% | 1.5% | 9.9% | 24.3% | -2.1% | -25.5% | 13.4% | 5.4% | -27.1% |
| France: | -0.4% | -8.8% | 4.7% | -17.9% | 4.0% | -4.5% | -23.7% | 9.7% | -23.2% | -29.6% |
| Italy | 2.6% | 0.6% | 6.0% | 42.9% | 11.9% | -4.1% | -25.7% | 9.6% | 12.9% | -30.0% |
| UK(EU) | -15.2% | 13.9% | 2.7% | -3.7% | -9.3% | -3.6% | -20.7% | 6.8% | 12.4% | -32.1% |

Tom Moeller
AuthorMore in Author Profile »Prior to joining Haver Analytics in 2000, Mr. Moeller worked as the Economist at Chancellor Capital Management from 1985 to 1999. There, he developed comprehensive economic forecasts and interpreted economic data for equity and fixed income portfolio managers. Also at Chancellor, Mr. Moeller worked as an equity analyst and was responsible for researching and rating companies in the economically sensitive automobile and housing industries for investment in Chancellor’s equity portfolio. Prior to joining Chancellor, Mr. Moeller was an Economist at Citibank from 1979 to 1984. He also analyzed pricing behavior in the metals industry for the Council on Wage and Price Stability in Washington, D.C. In 1999, Mr. Moeller received the award for most accurate forecast from the Forecasters' Club of New York. From 1990 to 1992 he was President of the New York Association for Business Economists. Mr. Moeller earned an M.B.A. in Finance from Fordham University, where he graduated in 1987. He holds a Bachelor of Arts in Economics from George Washington University.
More Economy in Brief


