 Global| Nov 20 2006
U.S. Leading Economic Indicators Better
by:Tom Moeller
|in:Economy in Brief
Summary
The composite index of leading economic indicators rose 0.2% last month after an upwardly revised 0.4% gain during September, according to the Conference Board. The back to back increases were the first since January and followed [...]
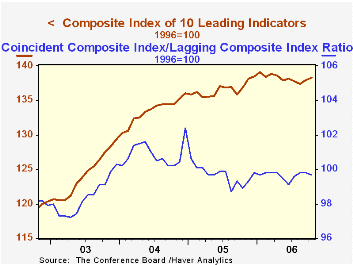
The composite index of leading economic indicators rose 0.2% last month after an upwardly revised 0.4% gain during September, according to the Conference Board. The back to back increases were the first since January and followed several monthly declines during 2006 but the October increase fell short of Consensus expectations for a 0.3% rise.
During the last ten years there has been a 59% correlation between the y/y change in the leading indicators and the lagged change in real GDP.
The breadth of one month gain amongst the 10 components of the leading index improved to 60%, the best since June.
Higher stock prices, improved consumer sentiment, and especially a higher money supply offset lower building permits and weaker vendor performance to generate the leader's increase last month.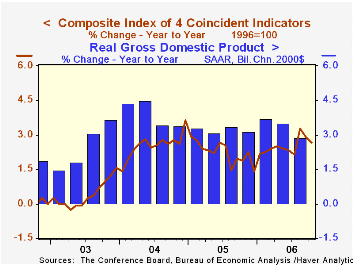
The method of calculating the contribution to the leading index from the spread between 10 year Treasury securities and the Fed funds rate has been revised. A negative contribution will now occur only when the spread inverts rather than when declining as in the past. More details can be found here.
The leading index is based on eight previously reported economic data series. Two series, orders for consumer goods and orders for capital goods, are estimated.
The coincident indicators increased 0.1% after an upwardly revised 0.2% increase during September. Over the last ten years there has been a 91% correlation between the y/y change in the coincident indicators and real GDP growth.
The lagging indicators increased 0.2% for the second month as the average duration of unemployment lengthened. The ratio of coincident to lagging indicators, which is a measure of actual economic performance versus excess, fell after three consecutive months of increase.
Visit the Conference Board's site for coverage of leading indicator series from around the world.
| Business Cycle Indicators | October | September | Y/Y | 2005 | 2004 | 2003 |
|---|---|---|---|---|---|---|
| Leading | 0.2% | 0.4% | 1.0% | 2.3% | 7.4% | 5.0% |
| Coincident | 0.1% | 0.2% | 2.7% | 2.2% | 2.5% | 0.4% |
by Louise Curley November 20, 2006
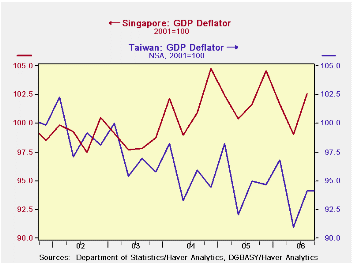
Seasonally unadjusted GDP data are available for the third quarter for Taiwan and Singapore. The year-over-year increase in real Taiwanese GDP in the third quarter was 4.4% while the nominal increase was 3.5% implying a decline in the deflator. While most other countries in the Asian Pacific region--even Japan--have seen a reversal of price trends from declines to modest increases, Taiwan is still experiencing declines. The year-over-year change in the deflator for Taiwan is compared with that of Singapore in the first chart. While both countries show considerable variation in the year-over-year changes in the deflators, there is a clear downward trend in the Taiwan data and a slight upward trend in the Singapore data.
Real growth in Taiwan increased 4.4% in the third quarter. So far this year growth has been steady at around the 4 plus percent level. Growth in Singapore, on the other hand, has declined over the year from 10.7% in the first quarter to 8.2% in the second and 7.2% in the third. The year-over-year growth in real GDP for the two countries is shown in the second chart.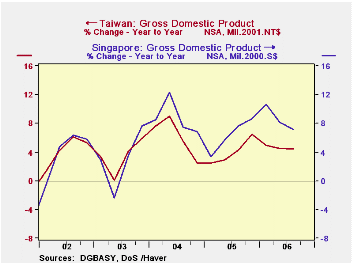
Taiwan and, particularly, Singapore are two of the smaller nations of the Pacific Rim. In dollar terms, the GDP of Taiwan is currently about $88 billion and Singapore, $33 billion, compared to Japan's $1.1 trillion. They have been, however, among the faster growing nations in the East.
| Q3 06 Y/Y % | Q2 06 Y/Y % | Q 1 06 Y/Y % | 2005 % | 2004 % | 2003 % | 2002 % | 2001 % | |
|---|---|---|---|---|---|---|---|---|
| TAIWAN GDP | ||||||||
| Current NT$ (NSA) | 3.37 | 3.35 | 3.47 | 3.49 | 4.38 | 1.22 | 3.37 | -1.69 |
| Real 2001 NT$ (NSA) | 4.92 | 4.57 | 4.39 | 4.03 | 6.07 | 3.43 | 4.25 | -2.17 |
| SINGAPORE | ||||||||
| Current S$ (NSA) | 9.78 | 6.76 | 8.15 | 6.96 | 12.48 | 1.98 | 3.27 | -4.03 |
| Real 2001 S$ (NSA) | 10.66 | 8.17 | 7.21 | 6.35 | 8.72 | 2.93 | 4.04 | -2.28 |

Tom Moeller
AuthorMore in Author Profile »Prior to joining Haver Analytics in 2000, Mr. Moeller worked as the Economist at Chancellor Capital Management from 1985 to 1999. There, he developed comprehensive economic forecasts and interpreted economic data for equity and fixed income portfolio managers. Also at Chancellor, Mr. Moeller worked as an equity analyst and was responsible for researching and rating companies in the economically sensitive automobile and housing industries for investment in Chancellor’s equity portfolio. Prior to joining Chancellor, Mr. Moeller was an Economist at Citibank from 1979 to 1984. He also analyzed pricing behavior in the metals industry for the Council on Wage and Price Stability in Washington, D.C. In 1999, Mr. Moeller received the award for most accurate forecast from the Forecasters' Club of New York. From 1990 to 1992 he was President of the New York Association for Business Economists. Mr. Moeller earned an M.B.A. in Finance from Fordham University, where he graduated in 1987. He holds a Bachelor of Arts in Economics from George Washington University.
More Economy in Brief


