 Global| Jun 03 2010
U.S. ISM Nonmanufacturing Index Is Unchanged But Job Growth At New High
by:Tom Moeller
|in:Economy in Brief
Summary
The rate of expansion in service sector activity has been steady this Spring. The Institute for Supply Management's (ISM) Composite Index for the service & construction sectors during May held at 55.4 for the third month, though that [...]
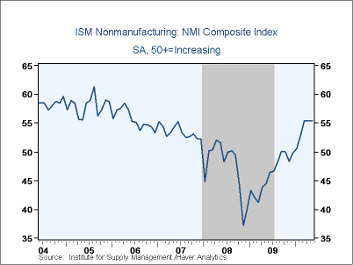
The rate of expansion in service sector activity has been steady this Spring. The Institute for Supply Management's (ISM) Composite Index for the service & construction sectors during May held at 55.4 for the third month, though that still was the highest level since early-2006. In addition, the series has risen considerably from a low of 37.2 late in 2008. The latest figure roughly matched Consensus expectations for a reading of 55.7. Since the series' inception in 1997 there has been a 65% correlation between the level of the composite index in the nonmanufacturing sector and the q/q change in real GDP for the services and the construction sectors.
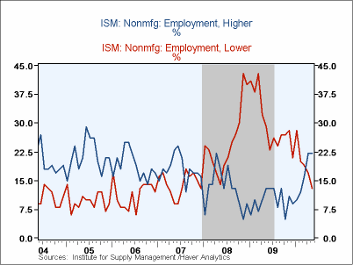
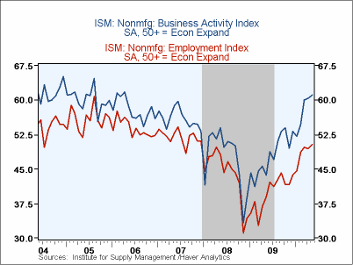
The employment index posted a gain to 50.4, its first month above the break-even level since December 2007. Twenty-two percent of respondents reported increased hiring while 13% reported fewer jobs. Since the series' inception in 1997 there has been an 80% correlation between the level of the ISM nonmanufacturing employment index and the m/m change in payroll employment in the service-producing plus the construction industries. The business activity index also rose m/m but new orders fell. Thirty-five percent of respondents reported higher orders while only 13% reported them lower. Vendor delivery speeds sped up marginally m/m but they're much slower than early last year.
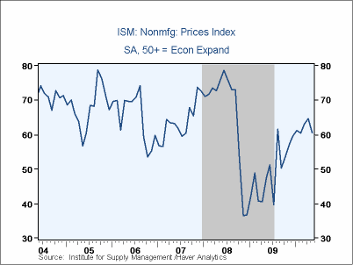
The pricing power index slipped to 60.6 but remained up sharply from the 2008 low. Thirty-five percent of respondents reported higher prices while 5% reported them lower. At the worst, late in 2008, 41% reported lower prices. Since its inception ten years ago, there has been a 73% correlation between the price index and the q/q change in the GDP services chain price index.
Beginning with the January 2008 Nonmanufacturing Report On Business ®, the composite index is calculated as an indication of overall economic conditions for the non-manufacturing sector. It is a composite index based on the diffusion indices of four of the indicators (business activity, new orders, employment and supplier deliveries) with equal weights. The latest report from the ISM can be found here.
| ISM Nonmanufacturing Survey | May | April | March | May '09 | 2009 | 2008 | 2007 |
|---|---|---|---|---|---|---|---|
| Composite Index | 55.4 | 55.4 | 55.4 | 44.5 | 46.2 | 47.3 | 53.5 |
| Business Activity | 61.1 | 60.3 | 60.0 | 43.6 | 48.0 | 47.4 | 56.0 |
| New Orders | 57.1 | 58.2 | 62.3 | 45.4 | 47.9 | 47.0 | 54.8 |
| Employment | 50.4 | 49.5 | 49.8 | 38.9 | 39.9 | 43.8 | 52.0 |
| Supplier Deliveries (NSA) | 53.0 | 53.5 | 49.5 | 50.0 | 49.0 | 51.1 | 51.1 |
| Prices Index | 60.6 | 64.7 | 62.9 | 47.4 | 49.4 | 66.0 | 63.8 |
by Tom Moeller June 3, 2010
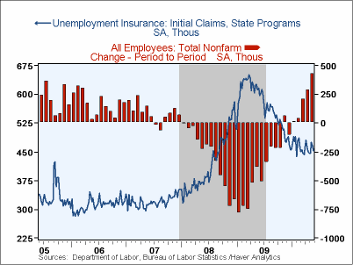
The Bureau of Labor Statistics indicated that initial claims for jobless insurance slipped another 10,000 to 453,000. That followed last week's 11,000 decline which was less than initially reported. The latest number matched Consensus expectations and claims remained near this cycle's lowest. Last week's figure was down from the recession peak of 651,000 reached in March of 2009 but the four-week moving average of initial claims ticked up to 459,000.
A 31,000 increase in continuing claims for unemployment insurance during the latest week reversed the declines during the prior two weeks. Nevertheless, claims remained near the cycle low and down by one-third from the June '09 peak. The overall decline is a function of the improved job market but also reflects the exhaustion of 26 weeks of unemployment benefits. Continuing claims provide an indication of workers' ability to find employment. The four-week average of continuing claims at 4.654M remained near the cycle low. This series dates back to 1966.
Extended benefits for unemployment insurance rose further w/w to 314,311 with recent changes to the duration benefits paid. However, they were down sharply from a peak of 597,688 reached in November.
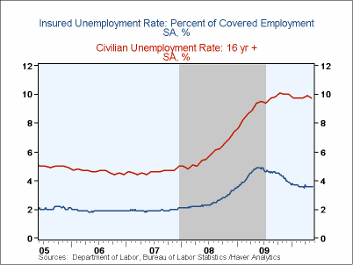
The insured unemployment rate remained at 3.6% where it has been since mid-February. The rate reached a high of 4.9% during May of 2009. During the last ten years, there has been a 96% correlation between the level of the insured unemployment rate and the overall rate of unemployment published by the Bureau of Labor Statistics.
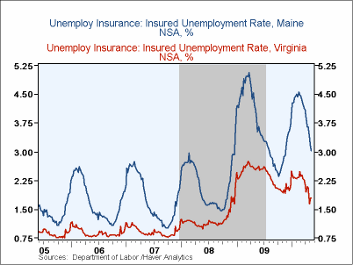
The highest insured unemployment rates in the week ending May 15 were in Puerto Rico (5.9 percent), Alaska (5.8), Oregon (5.2), Nevada (4.8), California (4.6), Pennsylvania (4.5), Wisconsin (4.4), North Carolina (4.3), Connecticut (4.1), Michigan (4.0), Montana (4.0), New Jersey (4.0), Rhode Island (4.0), and South Carolina (4.0). The lowest insured unemployment rates were in Virginia (1.8), Texas (2.2), Tennessee (2.6), Wyoming (2.7), Georgia (2.8), Maryland (2.8), Ohio (2.9), Maine (3.0) Florida (3.2) and New York (3.3). These data are not seasonally adjusted but the overall insured unemployment rate is.
The unemployment insurance claims data is available in Haver's WEEKLY database and the state data is in the REGIONW database.
| Unemployment Insurance (000s) | 05/29/10 | 05/22/10 | 05/15/10 | Y/Y | 2009 | 2008 | 2007 |
|---|---|---|---|---|---|---|---|
| Initial Claims | 453 | 463 | 474 | -26.5% | 572 | 419 | 321 |
| Continuing Claims | -- | 4,666 | 4,635 | -28.4 | 5,809 | 3,340 | 2,549 |
| Insured Unemployment Rate (%) | -- | 3.6 | 3.6 | 4.9 (5/2009) | 4.4 | 2.5 | 1.9 |
by Tom Moeller June 3, 2010
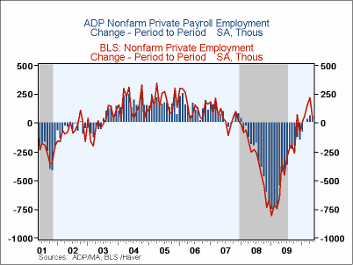
Employment gains continued last month. The latest report from the payroll processor ADP, in their National Employment Report, indicated that private nonfarm payroll levels rose in May by 55,000. The increase followed upwardly revised gains during the prior two months and was the fourth consecutive monthly rise.
ADP compiled the estimate from its database of individual companies' payroll information. Macroeconomic Advisers, LLC, the St. Louis economic consulting firm, developed the methodology for transforming the raw data into an economic indicator.
The U.S. Bureau of Labor Statistics will report May payroll employment tomorrow. As a comparison, the April increase of 65,000 in ADP's measure of private nonfarm payrolls was accompanied by a rise of 231,000 jobs in the BLS measure of private sector payrolls. According to ADP and Macro-Advisers, the correlation between the monthly percentage change in the ADP estimate and that in the BLS data is 0.90.
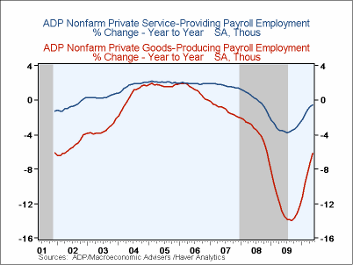
ADP reported that private service-producing industry employment rose for the fourth consecutive month with a gain of 78,000 (-0.5% y/y). Small-sized payrolls grew 37,000 (-0.3% y/y) while medium-sized payrolls grew 37,000 (-0.5% y/y). These increases were accompanied by a modest 4,000 gain (-1.2% y/y) in large service producing payrolls.
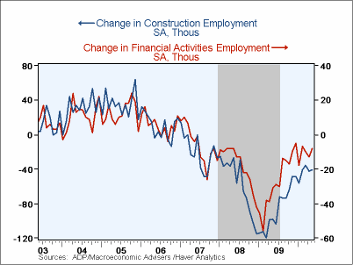
Goods producing employment fell another 23,000 during May though the three-month change eased to -1.4% (AR) versus -15.8% one year ago. In the manufacturing sector alone, however, payrolls rose 15,000 (-3.7% y/y) for the fourth consecutive monthly rise. Large goods producing payrolls slipped 1,000 (-6.3% y/y) while small-sized payrolls fell 24,000 (-7.5% y/y). New figures provided for construction employment indicated a moderating decline of 41,000 jobs. The greatest drop, 120,000, was logged during March of 2009. Financial activities jobs rose 5,000.
The ADP National Employment Report data is maintained in Haver's USECON database; historical figures date back to December 2000. The figures in this report cover only private sector jobs and exclude employment in the public sector. The full ADP National Employment Report can be found here and the ADP methodology is explained| ADP National Employment Report | May | April | March | Y/Y | 2009 | 2008 | 2007 |
|---|---|---|---|---|---|---|---|
| Total Nonfarm Private Payroll Employment (m/m Chg., 000s) | 55 | 65 | 32 | -1.5% | -4.9% | -0.7% | 1.1% |
| Small Payroll (1-49) | 13 | 18 | 8 | -1.3 | -4.1 | -0.1 | 1.8 |
| Medium Payroll (50-499) | 39 | 31 | 19 | -1.4 | -5.7 | -0.9 | 1.0 |
| Large Payroll (>500) | 3 | 16 | 5 | -2.2 | -5.6 | -1.8 | -0.2 |
| Goods Producing | -23 | -10 | -28 | -6.2 | -12.3 | -3.7 | -1.1 |
| Manufacturing | 15 | 31 | 7 | -3.7 | -11.1 | -3.0 | -1.7 |
| Service Producing | 78 | 75 | 60 | -0.5 | -3.3 | 0.0 | 1.7 |
by Robert Brusca June 3, 2010
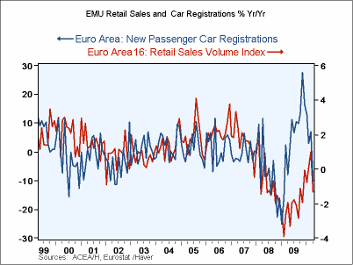
Euro-Area Retail sales broke off from their strong upswing and fell sharply in April. The 1.2% drop cut the Yr/Yr growth rate for sales to 1.0%. Meanwhile motor vehicle sales continued to plummet in the Zone and have fallen at a 22% pace over three-months and by 5.7% Yr/Yr. Motor Vehicle registrations dropped by 11.4% in April.
Germany and the UK among the early reporters show their sales in April each were up. Germany still shows a Yr/Yr sales decline, however, while UK sales are up by 1.7% Yr/Yr. Overall e-Zone sales have had their upward momentum cut.
Also on the day the revised Services PMI indices were released. The EMU index rose more strongly on revision while the UK index showed a meager increase from the previous month.
On one hand the weakness in retail sales suggests that all the problems in Greece and the knock-on effect on worries may have damaged consumer willingness to spend. We have seen the more topical consumer sentiment indices drop off already. But the services sector numbers tell us that economic improvement is still in train –and in the important job-creating services sector. The reality of the improvement should dominate the ephemeral worries except in those countries where real events are under strain such as Greece and possibly in Spain where the fiscal measures will have some bite. We are still waiting on the actions in other nations.
| Euro-Area Retail Sales | ||||||
|---|---|---|---|---|---|---|
| M/M | Saar | |||||
| Apr-10 | Mar-10 | Feb-10 | 3-Mo | 6-MO | 12-Mo | |
| Zone Total Volume | -1.2% | 0.5% | -0.1% | -3.1% | 1.8% | 1.0% |
| Registrations: | ||||||
| Motor Vehicle Reg | -11.4% | 3.3% | 2.4% | -22.8% | -16.5% | -5.7% |
| NonFood Country detail: Volume | ||||||
| Germany Value | 1.0% | -1.6% | 1.6% | 3.8% | -0.6% | -1.1% |
| UK(EU) Volume | 0.2% | 0.5% | 2.4% | 13.1% | -2.4% | 1.7% |
Tom Moeller
AuthorMore in Author Profile »Prior to joining Haver Analytics in 2000, Mr. Moeller worked as the Economist at Chancellor Capital Management from 1985 to 1999. There, he developed comprehensive economic forecasts and interpreted economic data for equity and fixed income portfolio managers. Also at Chancellor, Mr. Moeller worked as an equity analyst and was responsible for researching and rating companies in the economically sensitive automobile and housing industries for investment in Chancellor’s equity portfolio. Prior to joining Chancellor, Mr. Moeller was an Economist at Citibank from 1979 to 1984. He also analyzed pricing behavior in the metals industry for the Council on Wage and Price Stability in Washington, D.C. In 1999, Mr. Moeller received the award for most accurate forecast from the Forecasters' Club of New York. From 1990 to 1992 he was President of the New York Association for Business Economists. Mr. Moeller earned an M.B.A. in Finance from Fordham University, where he graduated in 1987. He holds a Bachelor of Arts in Economics from George Washington University.


