 Global| Jun 15 2010
U.S. Import Prices Fall With Lower Oil Costs
by:Tom Moeller
|in:Economy in Brief
Summary
U.S. import prices in May posted their second monthly decline this year with lower energy prices. The Bureau of Labor Statistics indicated that, overall, import prices fell 0.6% last month but the decline was short of Consensus [...]
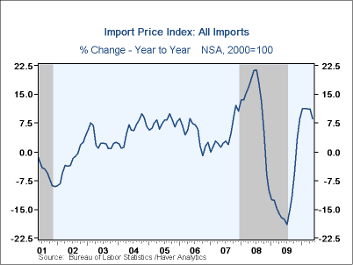 U.S. import prices in May posted their second
monthly decline this year with lower energy prices. The Bureau of Labor
Statistics indicated that, overall, import prices fell 0.6% last month
but the decline was short of Consensus expectations for a 1.3% drop.
Excluding petroleum, import prices rose 0.5%, the same as the upwardly
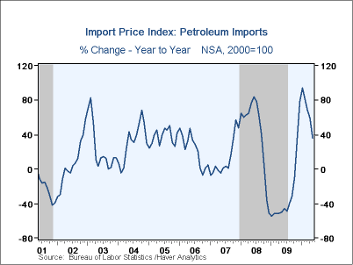
revised April increase. During the last twelve months, energy prices
increased by roughly one-third and non-oil import prices rose an
elevated 3.7%.
Petroleum prices fell 5.0% last month and more-than reversed the prior month's increase. Nevertheless, energy prices have risen 4.0% this year following last year's 78.6% increase from December-to-December. Yesterday, Brent crude oil prices rose to $75.15 per barrel, their highest since mid-May.
Non-oil import prices prices continued to reflect the dollar's earlier weakness as well as the firmer U.S. economy. Prices rose 0.5% in May following an upwardly revised 0.5% April increase. As a result, prices rose at a 3.5% annual rate since December and reversed last year's 4.1% decline. (During the last ten years, there has been a negative 81% correlation between the nominal trade-weighted exchange value of the US dollar vs. major currencies and the y/y change in non-oil import prices.)
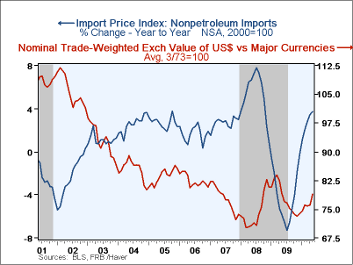 Stronger food & beverage prices continued to provide lift to
overall import prices this year with a 1.5% May increase, 12.8% (AR)
gain YTD. That compares to a 2.8% decline during 2009. Prices for
nonauto consumer goods also have turned and risen at a still-modest
0.7% rate this year after a 0.3% decline last year.
Appliance prices
have strengthened at a 5.3% rate after last year's more modest
increase. Apparel prices have risen at a 0.5% annual rate after no
change last year. Imported auto prices fell at a 1.1% rate YTD after a
0.4% uptick last year.
Capital goods slipped 0.5% YTD and
excluding computers also slipped 0.4% YTD following a 0.7% gain last
year.
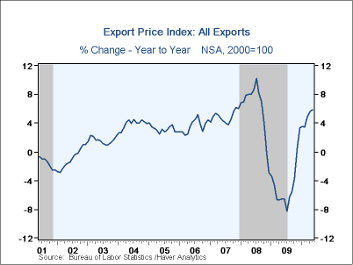
Total export prices continued firm with a 0.7% increase last month after a 1.2% April gain. The rise reflected a 0.6% gain (8.2% YTD) in non-agricultural export prices and a 1.4% jump in agricultural goods prices (0.3% YTD).
The import and export price series can be found in Haver's USECON database. Detailed figures are available in the USINT database.
The Global Recovery and Monetary Policy is this morning's speech by St. Louis Fed President James Bullard and it can be found here.
by Tom Moeller June 15, 2010
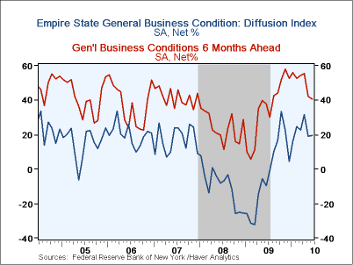 Business must be improving if it takes longer to
take delivery from sellers. The Federal Reserve Bank of New York
reported that its June Empire State Factory Index of General
Business Conditions increased modestly to 19.57 after a sharp
May decline. Nevertheless, the June level suggests positive growth in
factory sector activity. The latest reading matched Consensus
expectations.
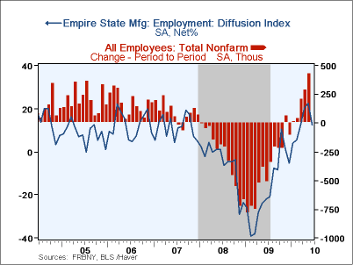
Shorter delivery times were the primary impetus for the gain in the overall index. The rise in the delivery-time index was to the highest level since 2004. Also rising modestly were the orders & shipments series though the gains failed to recoup earlier declines. The employment index also gave back increases during the prior two months but remained positive.
The figures are diffusion indexes. Since the series' inception in 2001, there has been a 75% correlation between the overall level and the three-month change in U.S. factory sector production. Like the Philadelphia Fed Index of General Business Conditions, the Empire State Business Conditions Index reflects answers to independent survey questions; it is not a weighted combination of the components. The series dates back only to 2001.
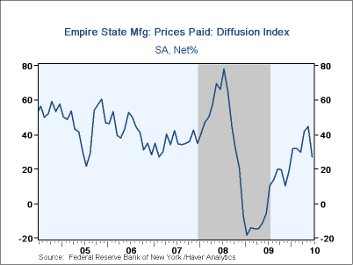
The prices paid index fell to 27.16 and reversed all of the gains earlier this year. Since inception there has been a 76% correlation between the index of prices paid and the three-month change in the core intermediate materials PPI.
The Empire State index of expected business conditions in six months slipped m/m to its lowest level since July of last year. Virtually all of the component series again fell including capital expenditures and technology spending They're both, however, well above the recession lows.
The Empire State Manufacturing Survey is a monthly survey of manufacturers in New York State. Participants from across the state in a variety of industries respond to a questionnaire and report the change in indicators from the previous month. Each index is seasonally adjusted. Respondents also state the likely direction of these same indicators six months ahead. For more on the Empire State Manufacturing Survey, including methodologies and the latest report, click here. The Empire State data is available in Haver's SURVEYS database.
| Empire State Manufacturing Survey | June | May | April | June '09 | 2009 | 2008 | 2007 |
|---|---|---|---|---|---|---|---|
| General Business Conditions (diffusion index,%) | 19.57 | 19.11 | 31.86 | -9.51 | -2.76 | -9.97 | 17.22 |
| New Orders | 17.53 | 14.30 | 29.49 | -7.58 | -2.52 | -6.22 | 15.70 |
| Inventories | -1.23 | 1.32 | 11.39 | -25.29 | -22.89 | -7.87 | -3.95 |
| Employment | 12.35 | 22.37 | 20.25 | -21.84 | -17.28 | -5.36 | 11.28 |
| Prices Paid | 27.16 | 44.74 | 41.77 | -5.75 | 1.33 | 46.99 | 35.64 |
by Tom Moeller June 15, 2010
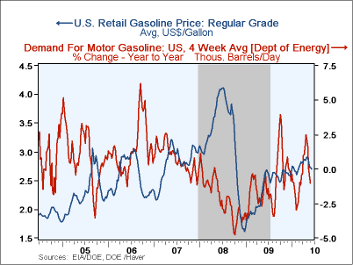 U.S. gasoline prices
slipped again last week. The pump price of regular gasoline of
$2.70 per gallon prices was down three cents w/w but that still left
prices up more than three-quarters since the December 2008 low.
Continuing the earlier reversal, the spot market price for a gallon of
regular gasoline rose yesterday to $2.02 which was the highest level in
four weeks. The figures are reported by the U.S. Department of Energy
and can be found in Haver's WEEKLY &
DAILY databases.
Also moving up was the average price for a barrel of light sweet crude (WTI) to $73.41 last week. Nevertheless the price remained down from the high of $84.23 averaged during April. Yesterday crude prices moved higher to $75.12 per barrel, up from the May 24th low of $66.88.
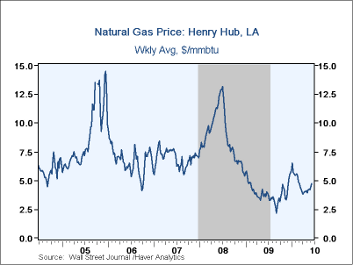
U.S. natural gas prices also have strengthened recently to an average $4.75 per mmbtu (33.4% y/y), the highest level since early-March. Nevertheless, prices remained down from a high of $6.50 early in January.
Demand for gasoline fell 1.0% last week versus one year ago and that compares to a 2.0% increase last month. The demand for residual fuel oil increased 4.8% while distillate demand surged 12.1% y/y. That's improved from a 12.3% decline during February. Inventories of crude oil and petroleum products slipped in early June but still were up sharply from the early-2010 low.
The energy price data can be found in Haver's WEEKLY database while the daily figures are in DAILY. The gasoline demand figures are in OILWKLY.
| Weekly Prices | 06/14/10 | 06/07/10 | 05/31/10 | y/y | 2009 | 2008 | 2007 |
|---|---|---|---|---|---|---|---|
| Retail Regular Gasoline ($ per Gallon, Regular) | 2.70 | 2.73 | 2.73 | 1.1% | 2.35 | 3.25 | 2.80 |
| Light Sweet Crude Oil, WTI ($ per bbl.) | 73.41 | 72.89 | 71.13 | 3.6% | 61.39 | 100.16 | 72.25 |
| Natural Gas Price ($/mmbtu) | 4.75 | 4.46 | 4.18 | 33.6% | 3.95 | 8.88 | 6.97 |
by Louise Curley June 15, 2010
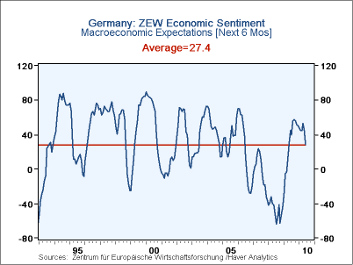
While German analysts and institutional investors who participate in the ZEW Survey have become less negative about current conditions, they have become much more concerned about the economic outlook six months ahead. The percentage excess of those looking for improvement over those looking for deterioration dropped to 28.7% in June from 45.8 % in May. The June value is close to the long term average of 27.4%, as seen in the first chart. The sovereign debt crisis in the Euro Area and the plans to improve government imbalances through stringent budgetary measures have, no doubt, been responsible for much of the sharp change in sentiment.
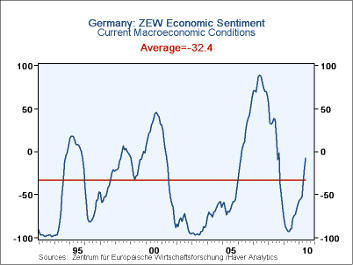
Increases in industrial production and exports and declines in the unemployment rate have resulted in a less negative appraisal of current condition. The pessimists among the German financial community exceeded the optimists by 7.9% in June, down from an excess of pessimist of 21.6% in May. German financial types tend to be pessimistic about current conditions. Over the entire period from December 1991 to the present, the average appraisal of current conditions is minus 32.4%, as seen in the second chart.
Last month, the participants in the survey were optimistic about the outlook for profits. The balance of people between those expecting increases in profits and those expecting decreases in profits rose for the Automotive, Chemical/Pharmaceutical, Steel, Machinery, Consumption/Trade, Construction, Utilities, Service, Telecommunication and Information Technology industries. Only Banking and Insurance industries were expected to do poorly. This month the balances between the people expecting increases in profits and those expecting decreases in profits have changed dramatically. Only in the Automotive, Chemical/Pharmaceutical and Machinery industries have the balances of opinion increased. In all other cases, expectations are for a deceleration in profit growth, and in the case of the consumption/trade industry, the participants expect a decline in profits, as can be seen in the table below.
| Jun 10 | May 10 | Apr 10 | Mar 10 | Feb 10 | Jan 10 | Dec 09 | Nov 09 | |
|---|---|---|---|---|---|---|---|---|
| Macroeconomic Expectation 6 mo Ahead (%Bal) | 28.7 | 45.8 | 53.0 | 44.5 | 45.1 | 47.2 | 50.4 | 51.1 |
| Current Economic Conditions (%Bal) | -7.9 | -21.6 | -39.2 | -51.9 | -54.8 | -56.6 | -60.6 | -65.6 |
| Responding Increase - Decrease in Profits (%Bal) | ||||||||
| Banking | 5.6 | 18.2 | 28.2 | |||||
| Insurance | 4.9 | 13.7 | 15.8 | |||||
| Automotive | 32.9 | 29.1 | 3.1 | |||||
| Chemical/Pharmaceutical | 59.4 | 56.4 | 48.2 | |||||
| Steel | 43.7 | 46.7 | 37.2 | |||||
| Electronics | 48.0 | 48.5 | 41.2 | |||||
| Machinery | 63.4 | 61.2 | 52.1 | |||||
| Consumption/Trade | -9.1 | 0.4 | -2.3 | |||||
| Construction | 0.4 | 11.0 | 10.4 | |||||
| Utilities | 0.8 | 21.5 | 20.5 | |||||
| Service | 19.6 | 29.4 | 30.6 | |||||
| Telecommunications | 6.2 | 10.8 | 7.8 | |||||
| Information Technology | 38.9 | 46.0 | 45.3 | |||||
But Is The Surplus Really On A Sustained Declining Trend?
by Robert Brusca June 15, 2010
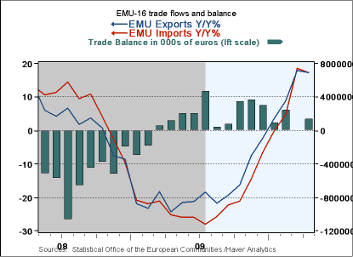 The seasonally adjusted and working day adjusted EMU trade balance
improved in April widening to €1.39Bln surplus. Still, the trend is for
the surplus to shrink. Growth rates show that exports and imports are
building on the earlier strong rates of growth, getting successively
larger over more recent periods- even with this month's backtracking.
Export and import categories are off across the board this month with one exception, a monthly rise in the export value of raw materials
The chart above shows a pattern for the surplus is that it is slowly deteriorating after peaking early in 2009. This is interesting because if European growth gets weak we would expect this pattern to reverse and to produce surpluses as growth slows and as imports slow down as domestic demand weakens. But, we also expect Europe to stave off surplus reduction because the euro is weak and the increase in competitiveness should expand exports and retard imports. The fact of the ongoing current surplus deterioration suggests that there is a J-Curve at work. The rise in the surplus this month may hint that we have reached the end of the J-curve effect. So, let's look at how that works.
The J-curve refers to the tendency for traded goods prices to react first to the change in the exchange rate and for trade volumes to react later. There is a timing asymmetry; in fact, there are probably several of them. For example, with the euro's fall in value there is not necessarily an immediate impact on export prices. Export prices are denominated in euros based on their euro-area costs. But export volumes eventually will respond positively to the exchange rate drop because unchanged euro-based export prices will translate them into much lower foreign currency prices.
Initially nothing happens to export prices. Secondly, the volume sold overseas eventually grows as overseas buyers respond to lower prices expressed in their domestic currency. Thirdly, eventually European exporters might even RAISE their euro prices to increase their profits more immediately, and blunt the degree of competitiveness improvement. But these latter two effects are second and third round occurrences. The initial effect on exports and export prices is that nothing much happens due to the exchange rate change.
Import prices, however, are under pressure from the very start of the currency weakening. The minute that the euro falls, foreign prices expressed in euro currency terms are adjusted up. For example $70/bbl oil that used to cost € 53.85 at € 1.30 will require € 58.33 at € 1.20. So the terms of trade (PX/PM) move sharply against a country as a first step after a currency drop. That means that the ratio drops as import prices rise faster then export prices (...and all other things the same, that will widen the trade deficit). But eventually because demand elasticities (demand responsiveness) are greater than one in absolute value, the percentage drop in import volumes will surpass the percentage rise in import prices, bringing about a drop in the value of imports and a rise in the trade surplus.
And, as discussed above, eventually the drop in foreign currency prices for exports will spur export volumes to expand in foreign markets. Both of these effects argue for an expanded surplus, eventually. But the immediate impact is that surplus gets smaller because price effects take place before demand impacts play out. The deterioration in the terms of trade is the dominant first-round effect and that creates the J-curve, a move in the wrong direction before a move in the right direction. Right now the combination of the J-curve effects driving up import prices up and stronger recovery growth sucking in imports is wining the battle against strong exports driven by a strong overseas recovery. As a result the surplus is shrinking. This is the first round, or the start of the J-curve effect, It is temporary and with the euro's drop slowing the one month rise in the trade surplus could be a hint of things to come.
Weaker growth in EMU could stem the ongoing rise in imports too, but so will the eventual response to higher import prices as the euro has fallen. One of theses effects will do it by enhancing growth; the other by retarding it. There will be little confusion about which effect is winning out. Either way, we expect Europe's surplus to return for good and for this declining phase in the surplus to prove temporary. Perhaps the rise in the monthly surplus is the start of that process.
Tom Moeller
AuthorMore in Author Profile »Prior to joining Haver Analytics in 2000, Mr. Moeller worked as the Economist at Chancellor Capital Management from 1985 to 1999. There, he developed comprehensive economic forecasts and interpreted economic data for equity and fixed income portfolio managers. Also at Chancellor, Mr. Moeller worked as an equity analyst and was responsible for researching and rating companies in the economically sensitive automobile and housing industries for investment in Chancellor’s equity portfolio. Prior to joining Chancellor, Mr. Moeller was an Economist at Citibank from 1979 to 1984. He also analyzed pricing behavior in the metals industry for the Council on Wage and Price Stability in Washington, D.C. In 1999, Mr. Moeller received the award for most accurate forecast from the Forecasters' Club of New York. From 1990 to 1992 he was President of the New York Association for Business Economists. Mr. Moeller earned an M.B.A. in Finance from Fordham University, where he graduated in 1987. He holds a Bachelor of Arts in Economics from George Washington University.


