 Global| Sep 17 2007
U.S. Import Price Inflation Tame
by:Tom Moeller
|in:Economy in Brief
Summary
Overall, August import prices fell 0.3% last month. The decline was led by a 1.3% drop in petroleum prices. Consensus expectations had been for a 0.2% increase. A reversal in that decline is likely for the September figures. Already [...]
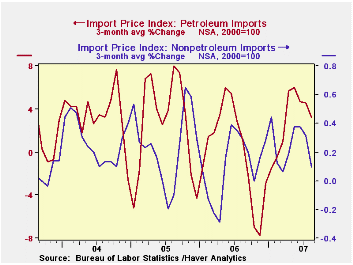
Overall, August import prices fell 0.3% last month. The decline was led by a 1.3% drop in petroleum prices. Consensus expectations had been for a 0.2% increase. A reversal in that decline is likely for the September figures. Already in September, prices for Brent crude oil have averaged $75.76 versus an August average of $70.80 and on Friday were $76.99.
Less petroleum, however import price inflation was also tame last month and posted a 0.1% decline. The decline was the first since January. It followed a bit of strength in 2Q when prices posted an average monthly increase of 0.9%. During the last ten years there has been a 66% (negative) correlation between the nominal trade-weighted exchange value of the US dollar vs. major currencies and the y/y change in non oil import prices. The correlation is a reduced 47% against a broader basket of currencies. Against a broad basket of major currencies, the dollar this year is down roughly 6% since yearend '06 and it's down roughly 10% from the high during 2005.Why a Dollar Depreciation May Not Close the U.S. Trade Deficit from the Federal Reserve Bank of New York is available here.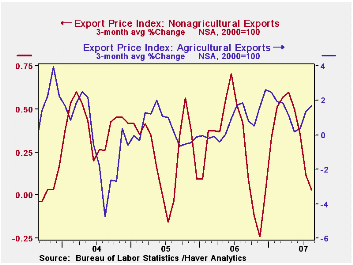
Lower prices for industrial supplies & materials excluding petroleum accounted for the decline in nonpetroleum prices last month with a 1.0% (+6.0% y/y) decline. Lower prices for chemicals (+3.8% y/y) led the m/m decline. Building materials prices also fell m/m (+0.8% y/y) as did . The detailed import price series can be found in the Haver USINT database.
Prices for nonauto consumer goods rose 0.2% (1.4% y/y) and apparel prices were unchanged m/m (0.6% y/y) after showing some strength early in the year.Capital goods prices rose 0.2% (0.4% y/y) for the fourth consecutive month. Prices for computers, peripheral and semiconductors rose 0.2% (-5.1% y/y). Less the high tech sector, capital goods prices rose 0.2% (2.8% y/y).
Overall export prices rose 0.2% and gains continued to decelerate. Enough to drop the y/y increase to 3.6% y/y from a high of 5.4% in February. Agricultural prices fell 1.0% (17.6% y/y) and nonagricultural export prices rose 0.1% (2.4% y/y).
| Import/Export Prices (NSA) | August | July | Y/Y | 2006 | 2005 | 2004 |
|---|---|---|---|---|---|---|
| Import - All Commodities | -0.3% | 1.3% | 1.9% | 4.9% | 7.5% | 5.6% |
| Petroleum | -1.3% | 6.4% | 1.5% | 20.6% | 37.6% | 30.5% |
| Non-petroleum | -0.1% | 0.1% | 2.3% | 1.7% | 2.7% | 2.6% |
| Export- All Commodities | -0.1% | 0.2% | 3.6% | 3.6% | 3.2% | 3.9% |
by Robert Brusca September 17, 2007
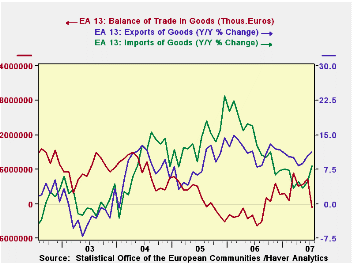
With the euro rising, it is not surprising to see the EMU area’s trade surplus erode. But the sharpness in the July erosion and the spurt in imports is good news that makes that erosion look more like it is due to a rekindling for growth than to a loss in competitiveness. This report is not a clear sign of export prospects. Retail data from Germany on export orders and on industrial output has showed some weakening. The export picture does not revive those fears nor does it ease them. To be sure the German wise-man Bofinger already has been talking of the prospect of using foreign exchange intervention - a clear sign that someone is getting hurt by the strong euro. But this month’s EMU trade erosion looks more like it is due to the good news of improved growth as the balance erosion is mostly due to the spurt in imports. With the dangers of financial contagion lurking, this report is somewhat reassuring. That, of course, does not mean that the ECB will no longer be under pressure or that Sarkozy will stop complaining about ECB policy. But an economy on stronger footing will make the ECB’s decisions somewhat easier if this hint of strength proves to be lasting.
| m/m% | % Saar | ||||
| Jul-07 | Jun-07 | 3M | 6M | 12M | |
| Balance* | €€ (651) | €€ 4,355 | €€ 2,346 | €€ 2,686 | €€ 1,796 |
| Exports | |||||
| All Exports | -0.5% | 1.9% | 8.0% | 5.2% | 11.3% |
| Food and Drinks | -- | 1.1% | 4.0% | 10.3% | 8.3% |
| Raw Materials | -- | -1.4% | 5.0% | 10.4% | 8.2% |
| MFG | -- | 0.9% | 1.9% | 4.4% | 9.5% |
| Imports | |||||
| All Imports | 3.6% | 1.1% | 22.5% | 9.5% | 8.3% |
| Food and Drinks | -- | 0.0% | 0.7% | 7.9% | 6.7% |
| Raw Materials | -- | -1.2% | 9.0% | 5.6% | 12.4% |
| MFG | -- | 0.2% | 2.2% | 2.3% | 7.6% |
| *Mil.Euros; mo or period average | |||||
by Tom Moeller September 17, 2007
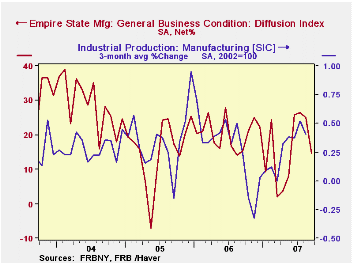
The index of manufacturing activity in New York State in September. The Index of General Business Conditions fell 10.4 points to 14.70 after its 1.4 point drop in August. A shallower decline to 18 had been expected. The figures are reported by the Federal Reserve Bank of New York.
Since the series' inception in 2001 there has been a 75% correlation between the index level and the three month change in U.S. factory sector industrial production.
Fewer new orders were reflected in the index's decline but the index for employment rose. The shipments index fell a whopping 23.73 points to a record low in negative territory.
Like the Philadelphia Fed Index of General Business Conditions, the Empire State Business Conditions Index reflects answers to an independent survey question; it is not a weighted combination of the components.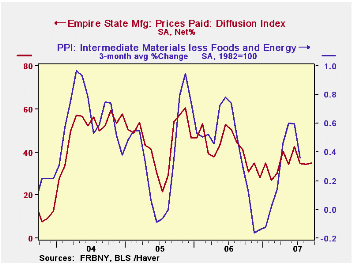
Pricing pressure eased somewhat as the prices paid index rose into positive territory for the first time in three month. Since 2001 there has been an 88% correlation between the index of prices paid and the three month change in the core intermediate materials PPI.
The Empire State index of expected business conditions in six months reversed most of its August improvement and fell 1.6% points.
The Empire State Manufacturing Survey is a monthly survey of manufacturers in New York State conducted by the Federal Reserve Bank of New York. Participants from across the state in a variety of industries respond to a questionnaire and report the change in a variety of indicators from the previous month. Respondents also state the likely direction of these same indicators six months ahead. April 2002 is the first report, although survey data date back to July 2001.For more on the Empire State Manufacturing Survey, including methodologies and the latest report, click here.
| Empire State Manufacturing Survey | September | August | Sept. '06 | 2006 | 2005 | 2004 |
|---|---|---|---|---|---|---|
| General Business Conditions (diffusion index) | 14.70 | 25.06 | 15.40 | 20.33 | 15.62 | 28.70 |
by Louise Curley September 17, 2007
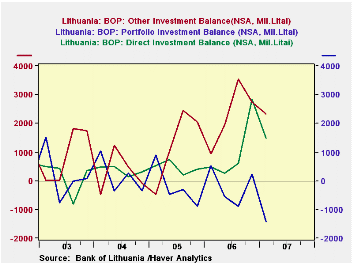
The current account deficits in the three Baltic countries, Estonia, Latvia and Lithuania have sky rocketed in the last year or so. In the first quarter of this year, Lithuania reported that its current account deficit as a percent of Gross Domestic Product was 12%, For Estonia, the figure was 17% and for Latvia, 27%. The first chart shows the current account deficits as a percentage of GDP for the three countries.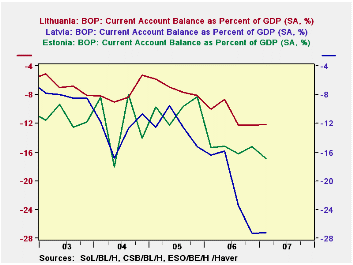
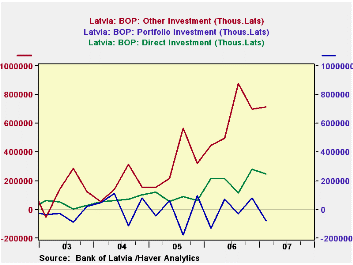
All three countries have experienced high rates of growth largely as a result of increased consumption and residential investments. In all three countries, the net inflow of foreign funds has helped to finance this growth. Of some concern, however, is the predominance of "other investments". These inflows have exceeded the net inflow of both direct and portfolio investments in the last year or so as can be seen in the second, third and fourth charts. The net inflow of "other investments" more than doubled between 2005 and 2006 in Estonia and Latvia and almost doubled in Lithuania. "Other investments," which include, among other things, loans to banks and unaffiliated persons tend to be more short-term oriented and more volatile than either direct or portfolio investment. The fifth chart that shows short-term and long-term "other investment" liabilities for Estonia, the only one of the three countries that reports short and long "other investments".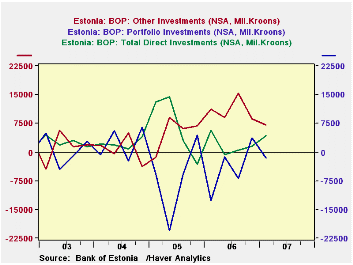
The extraordinarily large deficits have led to a down grading of the ratings on the external debt of these countries. In addition, concerns are being raised regarding the safety of their currencies. Economic trends in these countries can be tracked in the Haver data base EMERGECW and daily changes in the foreign exchange rates can be tracked in the Haver data base INTDAILY. Later this month second quarter data on the balance of payments will be released. 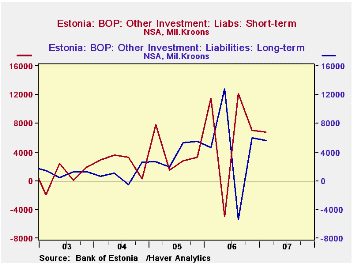
| Q1 2007 | Q4 2006 | Q3 2006 | Q2 2006 | Q1 2006 | Q4 2005 | 2006 | 2005 | |
|---|---|---|---|---|---|---|---|---|
| CURRENT ACCOUNT/GDP (%) | ||||||||
| Estonia | -16.88 | -15.25 | -16.23 | -15.18 | -15.41 | -8.29 | -15.52 | -9.97 |
| Latvia | -27.21 | -27.34 | -23.41 | -15.88 | -16.48 | -15.28 | -20.78 | -12.47 |
| Lithuania | -12.13 | -12.30 | -12.28 | -8.70 | -9.98 | -8.12 | -10.82 | -7.15 |
| NET INFLOW OF "OTHER INVESTMENT" | ||||||||
| Estonia (Mil. Kroon) | 7097.7 | 9600.5 | 15370.6 | 8940.2 | 11118.4 | 6919.17 | 44029.8 | 2053.8 |
| Latvia (Mil. Lats) | 715.4 | 700.1 | 879.3 | 499.4 | 448.8 | 312.3 | 2522.3 | 1261.9 |
| Lithuania (Mil. Litas) | 2334.8 | 2730.2 | 3541.3 | 1933.1 | 936.2 | 2059.5 | 9140.8 | 5063.4 |

Tom Moeller
AuthorMore in Author Profile »Prior to joining Haver Analytics in 2000, Mr. Moeller worked as the Economist at Chancellor Capital Management from 1985 to 1999. There, he developed comprehensive economic forecasts and interpreted economic data for equity and fixed income portfolio managers. Also at Chancellor, Mr. Moeller worked as an equity analyst and was responsible for researching and rating companies in the economically sensitive automobile and housing industries for investment in Chancellor’s equity portfolio. Prior to joining Chancellor, Mr. Moeller was an Economist at Citibank from 1979 to 1984. He also analyzed pricing behavior in the metals industry for the Council on Wage and Price Stability in Washington, D.C. In 1999, Mr. Moeller received the award for most accurate forecast from the Forecasters' Club of New York. From 1990 to 1992 he was President of the New York Association for Business Economists. Mr. Moeller earned an M.B.A. in Finance from Fordham University, where he graduated in 1987. He holds a Bachelor of Arts in Economics from George Washington University.
More Economy in Brief


