 Global| Apr 16 2009
U.S. Housing Starts Fall to Second Lowest Level on Record But Bottom May Be Forming
by:Tom Moeller
|in:Economy in Brief
Summary
The breather in the housing market downturn proved short-lived as housing starts fell to the second lowest level on record. The Commerce Department indicated that total housing starts in March reversed nearly all of their February [...]
The breather in the housing market downturn proved short-lived as housing starts fell to the second lowest level on record. The Commerce Department indicated that total housing starts in March reversed nearly all of their February gain and fell 10.8% to 510,000. The February level was revised down slightly and the latest figure compares to Consensus expectations for 550,000 starts.
The reversal occurred as starts of multi-family homes fell
29.0% to 152,000 after a downwardly revised 62.1% February increase.
The latest levels are the lowest since the early 1990s.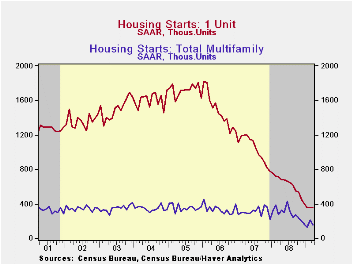
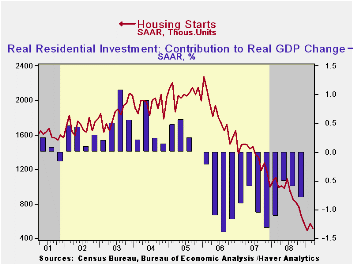
Despite these latest declines, a bottom in the housing market seems to be forming. Starts of single-family homes were unchanged last month at 358,000 after a slight uptick in February. Nevertheless, they remained near the record low for the series which dates back to 1959. The latest level is down eighty percent since the peak in early 2006. During the last ten years, there has been an 84% correlation between the q/q change in single-family starts and their contribution to quarterly GDP growth.
By region, starts of single-family units in the Northeast roughly repeated their February gain and rose 30.6% (-29.9% y/y). Starts in the Midwest ticked up a lesser 3.6% (-47.2% y/y) after their sharp 17.0% February recovery but in the South, single-family starts were quite weak. They fell to a new record low (-49.7% y/y). In the West, starts also were depressed as their 3.3% uptick (-59.6% y/y) followed a 25.6% February decline. Starts here have fallen 87.3% from their 2005 peak.
The latest figures covering permits to build single-family homes, a leading indicator of starts, also suggest that a bottom in housing activity may be forming. Though they fell 7.4% last month, that followed a 16.1% rise in February and permits roughly equal the December level.
The housing starts figures can be found in Haver's USECON database.
The Fed's latest Beige Book covering regional economic conditions can be found here.
| Housing Starts (000s, SAAR) | March | February | January | Y/Y | 2008 | 2007 | 2006 |
|---|---|---|---|---|---|---|---|
| Total | 510 | 572 | 488 | -48.4% | 903 | 1,341 | 1,812 |
| Single-Family | 358 | 358 | 356 | -49.6 | 617 | 1,034 | 1,474 |
| Multi-Family | 152 | 214 | 132 | -45.1 | 286 | 307 | 338 |
| Building Permits | 513 | 564 | 531 | -45.0 | 880 | 1,389 | 1,844 |
by Robert Brusca April 16, 2009
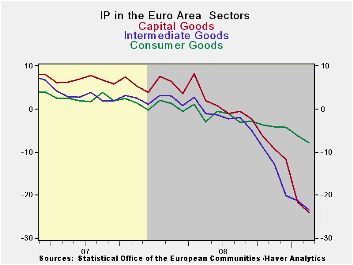
The chart above makes it clear that it is not the consumer
sector that is leading IP lower in Europe. Capital goods and
intermediate goods output are falling by 23% Year/Year compared to
consumer goods output that is down by just 7.7%. Over three months
capital goods output is declining at a 41% pace and intermediates goods
output is off at a 23% pace compared to minus 10% for consumer goods.
In the quarter to date the same sorts of caution hold sway as Q1 is
shaping up to be a terrible quarter for the industrial sector. Moreover
the rates of declines have sped up from 12-months to 6-months to three
months. Across countries German shows the a clear persisting pattern of
deceleration in industrial output. France and Spain see their growth
rates slowing the rate of decline over three months compared to six
months while Italy and the UK show flat growth rates in three months
compared to six months.
Still there is scant goods in the Area’s industrial sector
this month. The preference is in step with ongoing declines in
industrial output in the US extraordinary weakness in Japan and in
China; China has posted another drop in exports (fifth monthly drop in
a row) and registered its slowest growth rate in about a decade. The
pull back is global and it is still pulling back. It may be slowing but
not even that is clear.
| E-Area MFG IP | ||||||||||
|---|---|---|---|---|---|---|---|---|---|---|
| Saar except m/m | Mo/Mo | Feb 09 |
Jan 09 |
Feb 09 |
Jan 09 |
Feb 09 |
Jan 09 |
|||
| E-Area Detail | Feb 09 |
Jan 09 |
Dec 08 |
3Mo | 3Mo | 6mo | 6mo | 12mo | 12mo | Q-1 |
| MFG | -2.4% | -3.2% | -3.3% | -30.3% | -31.7% | -28.4% | -24.7% | -19.6% | -17.5% | -30.9% |
| Consumer | -1.6% | -0.8% | -0.3% | -10.4% | -7.4% | -9.2% | -6.9% | -7.7% | -6.2% | -9.6% |
| C-Durables | -4.3% | -1.8% | -2.5% | -29.4% | -28.8% | -28.5% | -21.3% | -21.2% | -16.9% | |
| C-Non-durables | -1.4% | -0.7% | -0.1% | -8.3% | -4.8% | -6.3% | -4.5% | -5.9% | -4.5% | |
| Intermediate | -2.4% | -1.0% | -6.4% | -32.9% | -37.3% | -34.0% | -30.6% | -23.4% | -21.3% | -32.0% |
| Capital | -3.0% | -7.0% | -2.9% | -41.0% | -41.5% | -35.8% | -30.4% | -23.9% | -21.5% | -43.3% |
| Main E-Area Countries and UK IP in MFG | ||||||||||
| Mo/Mo | Feb 09 |
Jan 09 |
Feb 09 |
Jan 09 |
Feb 09 |
Jan 09 |
||||
| MFG Only | Feb 09 |
Jan 09 |
Dec 08 |
3Mo | 3Mo | 6mo | 6mo | 12mo | 12mo | Q-2- Date |
| Germany: | -3.4% | -7.3% | -4.8% | -47.3% | -48.9% | -39.3% | -32.0% | -22.5% | -19.6% | -49.1% |
| France: IPxConstruct'n | -0.5% | -3.9% | -1.6% | -21.5% | -28.7% | -24.7% | -22.9% | -15.5% | -14.5% | -25.9% |
| Italy | -4.0% | -1.1% | -4.2% | -31.6% | -28.6% | -31.1% | -24.8% | -20.3% | -16.8% | -28.6% |
| Spain | 1.5% | -7.9% | 1.4% | -19.5% | -46.6% | -24.6% | -40.3% | -24.0% | -24.6% | -37.0% |
| UK: EU member | -0.9% | -3.0% | -1.9% | -20.7% | -27.4% | -20.4% | -20.2% | -13.8% | -13.0% | -24.2% |
by Tom Moeller April 16, 2009
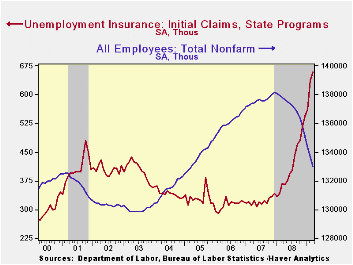
Initial claims for unemployment insurance gave another indication that the worst of the labor market's deterioration is moderating. The level of 610,000 claims last week was down from an upwardly revised 663,000 and it was the second consecutive weekly fall. Consensus expectations for 660,000 claims.
The Labor Department indicated that the largest increases in initial claims for the week ending April 4 were in Michigan (+5,408), Missouri (+4,986), Texas (+3,734), New Jersey (+2,368), and Pennsylvania (+2,194), while the largest decreases were in California (-4,708), Ohio (-2,716), Alabama (-2,421), Florida (-1,539), and Wisconsin (-1,078).
Continuing claims for unemployment insurance reached yet
another record high of 6,022,000 and now they have more than
doubled the year ago level. The series dates back to 1966.
The four-week average of continuing claims also rose to another record
of 5,796,000. Continuing claims provide some indication of workers'
ability to find employment and they lag the initial claims figures by
one week.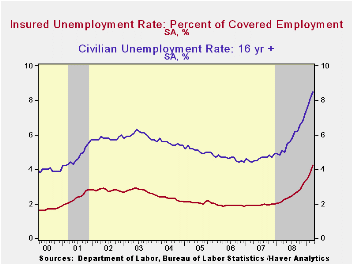
Though the latest level of continuing claims was a record, the labor force has grown as well, by nearly 30% over the last twenty years. Therefore, the insured rate of unemployment is not at a record high. It rose slightly to 4.5% which was the highest since 1983. During the last ten years there has been a 93% correlation between the level of the insured unemployment rate and the overall rate of unemployment published by the Bureau of Labor Statistics.
The 4.4% insured unemployment rate by far understates labor market distress in some states. The highest insured unemployment rates in the week ending March 28 were in Michigan (8.0 percent), Oregon (7.9), Rhode Island (7.1), Idaho (7.0), Wisconsin (7.0), Pennsylvania (6.7), Nevada (6.2), Alaska (6.0), Montana (6.0), and Vermont (5.9).
Employment covered under the unemployment insurance program has risen sharply. The Labor Department indicated that 133.9 million workers were covered and that total amounts to 87% of the civilian labor force. The percentage has been roughly stable for the last ten years but it is up sharply from 60% to 65% in the mid-1970s.
The unemployment insurance claim data is available in Haver's WEEKLY database.
Recession or Depression? Part II from the Federal Reserve Bank of St. Louis can be found here.
What's Under The Tarp?, also from the St. Louis Fed, is available here.
| Unemployment Insurance (000s) | 04/11/09 | 04/04/09 | 03/28/09 | Y/Y | 2008 | 2007 | 2006 |
|---|---|---|---|---|---|---|---|
| Initial Claims | 610 | 663 | 674 | 65.3% | 420 | 321 | 313 |
| Continuing Claims | -- | 6,022 | 5,850 | 102.4% | 3,342 | 2,552 | 2,459 |
by Tom Moeller April 16, 2009
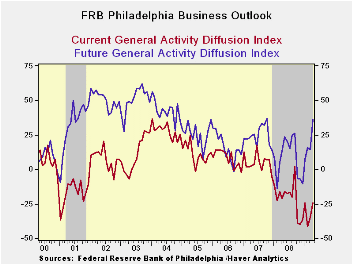
The Philadelphia Federal Reserve Bank indicated that economic activity in the region continued to contract during April. The Index of General Business conditions in the manufacturing sector came in at -24.4 versus a reading of -35.0 last month and a low of -41.3 in February. The latest beat expectations for a reading of -32
Though the latest figure remained negative it may indicate that the decline in economic activity is moderating. During the last ten years there has been a 70% correlation between the level of the Philadelphia Fed Business Conditions Index and the three-month growth in factory sector industrial production. There has been a 64% correlation with q/q growth in real GDP.
The Philadelphia Fed constructs a diffusion index for total
business activity and each of the sub-indexes. The business conditions
index reflects a separate survey question.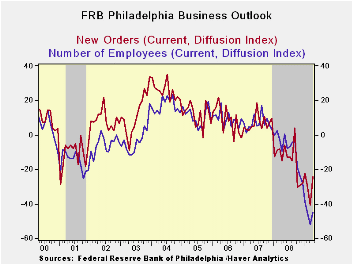
Amongst the sub-indexes the new orders component improved to the highest level since January as 19.8% of respondents reported higher orders. That was double the March low. The index of unfilled orders also rose to its highest since last September. Still under pressure, however, was the employment index which improved just slightly from the March record low. Forty-five percent of respondents expected to reduce employment levels, while only 0.2% expected to raise them. During the last ten years there has been a 79% correlation between the index level and the m/m change in manufacturing sector payrolls.
The prices paid index at -31.5 was near the record low. Five percent of respondents planned to raise prices while thirty six percent expected to lower them. During the last ten years there has been a 73% correlation between the prices paid index and the three-month growth in the intermediate goods PPI. There has been an 82% correlation with the change in core intermediate goods prices.
The separate index of expected business conditions in six months improved its highest level since late 2007. The expectations index for new orders and shipments surged but expectations index for employment improved just moderately.
The figures from the Philadelphia Federal Reserve can be found in Haver's SURVEYS database.
The latest Business Outlook Survey from the Federal Reserve Bank of Philadelphia can be found here.
| Philadelphia Fed (%) | April | March | April '08 | 2008 | 2007 | 2006 |
|---|---|---|---|---|---|---|
| General Activity Index | -24.4 | -35.0 | -21.1 | -21.3 | 5.0 | 8.0 |
| Prices Paid Index | -31.5 | -31.3 | 53.8 | 36.4 | 26.3 | 36.7 |

Tom Moeller
AuthorMore in Author Profile »Prior to joining Haver Analytics in 2000, Mr. Moeller worked as the Economist at Chancellor Capital Management from 1985 to 1999. There, he developed comprehensive economic forecasts and interpreted economic data for equity and fixed income portfolio managers. Also at Chancellor, Mr. Moeller worked as an equity analyst and was responsible for researching and rating companies in the economically sensitive automobile and housing industries for investment in Chancellor’s equity portfolio. Prior to joining Chancellor, Mr. Moeller was an Economist at Citibank from 1979 to 1984. He also analyzed pricing behavior in the metals industry for the Council on Wage and Price Stability in Washington, D.C. In 1999, Mr. Moeller received the award for most accurate forecast from the Forecasters' Club of New York. From 1990 to 1992 he was President of the New York Association for Business Economists. Mr. Moeller earned an M.B.A. in Finance from Fordham University, where he graduated in 1987. He holds a Bachelor of Arts in Economics from George Washington University.
More Economy in Brief


