 Global| Oct 07 2008
U.S. Gasoline Prices Fell toLowest Since April, Demand Growth Lowest Since 1997
by:Tom Moeller
|in:Economy in Brief
Summary
For a gallon of regular gasoline, the retail price fell by a nickel last week to the lowest level since mid-April. According to the U.S. Department of Energy survey, at an average of $3.48 per gallon gasoline prices are down 63 cents [...]
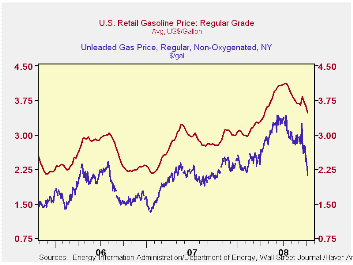
For a gallon of regular gasoline, the retail price fell by a nickel last week to the lowest level since mid-April. According to the U.S. Department of Energy survey, at an average of $3.48 per gallon gasoline prices are down 63 cents since their peak in early July, or by 15.3%. Despite the recent decline, prices remained up by more than one quarter from the year ago level of $3.00. The latest decline was accompanied by a drop in the average price for all grades of gasoline to $3.54 per gallon.
Versus Friday, the spot market price for a gallon of regular
gasoline plunged another twenty cents per gallon to $2.12. The drop
lowered prices to their lowest since October of last year. In futures
trading the November contract closed even lower at $2.06 per gallon.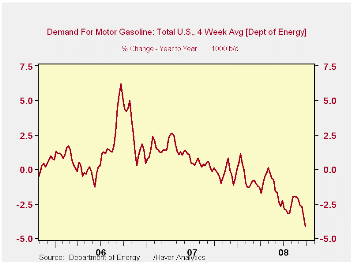
Weekly gasoline prices can be found in Haver's WEEKLY database. Daily prices are in the DAILY database.
According to the U.S. Department of Energy, the demand for gasoline fell 1.9% during the last four weeks. That was the largest weekly decline since early 2005 and continued to reflect a drop off in seasonal driving. The weakness in gasoline demand goes beyond that. It was down 4.1% y/y, the largest y/y decline since early 1997.
The DOE figures are available in Haver's OILWKLY database.
The price for a barrel of West Texas Intermediate crude oil reversed the prior week's gain and fell to an average $98.58 per barrel, down from the high in July of $145.66. WTI crude prices yesterday were quite weak and they fell to $87.82 /bbl.
Yesterday, the two-month futures price for crude oil fell to
$86.71 per barrel.
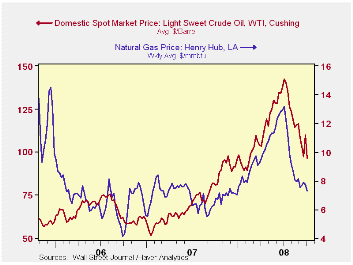
Last week, prices for natural gas fell to an average $7.30 per mmbtu (+8.1% y/y). Prices fell further yesterday to $7.14/mmbtu. The high for natural gas prices was in early July at $13.19/mmbtu.
Subprime Outcomes: Risky Mortgages, Homeownership Experiences and Foreclosures from the Federal Reserve Bank of Boston is available here.
| Weekly Prices | 10/06/08 | 09/29/08 | Y/Y | 2007 | 2006 | 2005 |
|---|---|---|---|---|---|---|
| Retail Regular Gasoline ($ per Gallon) | 3.48 | 3.63 | 25.8% | 2.80 | 2.57 | 2.27 |
| Light Sweet Crude Oil, WTI ($ per bbl.) | 98.68 | 110.09 | 20.0% | 72.25 | 66.12 | 56.60 |
by Tom Moeller October 7, 2008
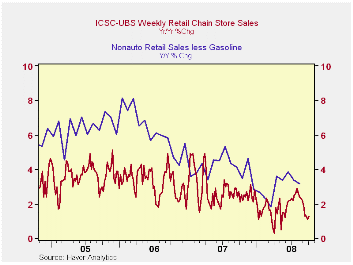
According to the International Council of Shopping Centers, chain store sales inched up 0.1% last week after the prior week's 0.2% dip. The level of sales in early October were 0.9% below the September average which fell 1.9% from August.
The level of sales during the latest week was near the lowest since December of last year.
During the last ten years there has been a 45% correlation between the y/y change in chain store sales and the change in nonauto retail sales less gasoline.
The ICSC-UBS retail
chain-store sales index is constructed using the same-store sales
(stores open for one year) reported by 78 stores of seven retailers:
Dayton Hudson, Federated, Kmart, May, J.C. Penney, Sears and Wal-Mart.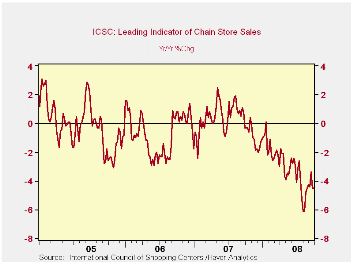
The leading indicator of chain store sales from ICSC-UBS fell 0.9% (-4.5% y/y) like during the prior week.
The chain store sales figures are available in Haver's SURVEYW database.
Credit Card Debt and Payment Use from the Federal Reserve Bank of Boston is available here.
| ICSC-UBS (SA, 1977=100) | 10/04/08 | 09/27/08 | Y/Y | 2007 | 2006 | 2005 |
|---|---|---|---|---|---|---|
| Total Weekly Chain Store Sales | 481.5 | 480.9 | 1.3% | 2.8% | 3.3% | 3.6% |
by Tom Moeller October 7, 2008
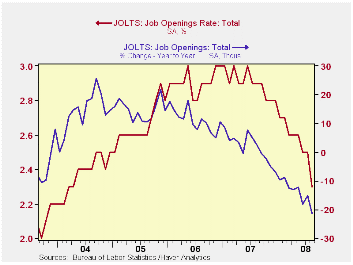
The Bureau of Labor Statistics indicated in its Job Openings & Labor Turnover Survey (JOLTS) report for August that the number of job openings fell 6.1% (-21.2% y/y) from July. The drop followed a 0.1% downtick during July and since the peak in January of 2007 the number of job openings have fallen 23.9%.
The job openings rate also fell. The August rate was down to 2.3% versus an upwardly revised 2.5% in July. The latest figures are down from near 3% one year ago. The job openings rate is the number of job openings on the last business day of the month as a percent of total employment plus job openings.
The actual number of job openings in the construction sector
dropped 7.4% (-39.6% y/y) but the number of job openings in the manufacturing sector rose 10.0%
(-22.2% y/y). Professional & business services job openings
fell by roughly one quarter m/m (-21.6% y/y) while openings in the
education & health sectors dropped 5.7% (-7.4% y/y) after two
months of increase. Openings in retail trade rose 2.9% (-5.6% y/y).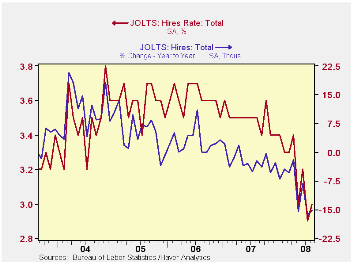
By region, openings in the West fell by nearly one-third from the year ago level while openings in the Northeast fell by 15.6% y/y. They were down by 23.9% y/y in the South and off 12.2% y/y in the Midwest.
The hires rate ticked up to 3.0% from a downwardly revised July rate of 2.9%. The latest remained near the low for this cycle and it was the lowest since early-2003.The hires rate is the number of hires during the month divided by employment.The actual number of hires rose 1.1% (-15.1% y/y) after a revised 9.3% July drop. Hires in the construction sector reversed all of their July plop with a 37.2% jump. In the factory sector hires rose 2.8% (-26.9% y/y) and in the professional & business services sector they fell 3.9% (-7.3% y/y). In the leisure and hospitality sector hires reversed most of the prior month's gain and fell 4.5% (-15.1% y/y.
The job separations rate remained stable m/m at 3.2%, near the lowest since 2003. Separations include quits, layoffs, discharges, and other separations as well as retirements. The level of job separations fell 3.5% y/y.
The JOLTS survey dates only to December 2000 but has since followed the movement in nonfarm payrolls, though the actual correlation between the two series is low.
A description of the Jolts survey and the latest release from
the U.S. Department of Labor is available here.
Fed Chairman Ben S. Bernanke's speech titled Current Economic and Financial Conditions to the National Association for Business Economics can be found here.
| JOLTS (Job Openings & Labor Turnover Survey) | August | July | August '07 | 2007 | 2006 | 2005 |
|---|---|---|---|---|---|---|
| Job Openings, Total | ||||||
| Rate (%) | 2.3 | 2.5 | 2.9 | 2.8 | 3.0 | 2.8 |
| Total (000s) | 3,278 | 3,492 | 4,162 | 3,974 | 4,272 | 3,863 |
| Hires, Total | ||||||
| Rate (%) | 3.0 | 2.9 | 3.5 | 41.9 | 43.4 | 43.1 |
| Total (000s) | 4,070 | 4,026 | 4,796 | 57,771 | 59,153 | 57,501 |
by Robert Brusca October 7, 2008
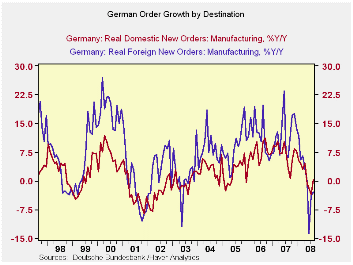
The German economy shows some resilience in its factory sector in August as orders reverse a string of eight months of declines to rise by 3.6% in August. Overall and foreign orders had previously each fallen for eight months in a row. Such a string of negativism does simply go way without some good reason. AND right now we don’t have any reason at all. The upward surprise builds on a similar upward surprise from retail sales in the month. Even so trends in both sectors still point lower. In the case of retail sales, some calendar effects may have helped to boost those sales. In the case of factory orders there appears to be some lumpy orders that constitute ‘one-off’ events leaving us expecting more weakness in the months ahead.
German foreign orders remain in a consistent weak pattern with flatness or sequential slowing in trends well in train. Domestic orders are more resilient actually showing an accelerating profile from 12-months to 6-months to 3-months. This pattern appears to be more the result of some statistical oddity than something that is in sync with the realities of the economic data we have been seeing. The domestic German economy definitely is not accelerating.
Still the MFG sales trends continue to be upbeat for most classes of goods except consumer nondurables. Consumer durables sales jumped in August after a drop in July.
All this may raise some question marks about the future. But, with the euro still overly strong and the financial crisis spreading in Europe, the safest bet is that this month’s buoyancy is an unrepeatable bit of good news. Economic conditions in Germany will continue to get worse.
| German Orders and Sales By Sector and Origin | ||||||||
|---|---|---|---|---|---|---|---|---|
| Real and SA | % M/M | % Saar | ||||||
| Aug-08 | Jul-08 | Jun-08 | 3-MO | 6-Mo | 12-Mo | YrAgo | QTR-to-Date | |
| Total Orders | 3.6% | -1.3% | -2.6% | -1.2% | -0.6% | -1.3% | 4.7% | -7.7% |
| Foreign | 3.5% | -0.3% | -4.5% | -5.5% | -2.8% | -3.0% | 6.1% | -7.3% |
| Domestic | 3.7% | -2.2% | -0.5% | 3.2% | 1.6% | 0.4% | 3.3% | -8.2% |
| Real Sector Sales | ||||||||
| MFG/Mining | 4.1% | -2.4% | -0.2% | 5.3% | 2.6% | 2.2% | 5.8% | -4.0% |
| Consumer | 2.3% | -0.4% | -1.4% | 2.0% | 1.0% | -1.7% | 1.6% | -1.0% |
| Cons Durables | 7.1% | -4.2% | 1.7% | 18.4% | 8.8% | -1.0% | 0.8% | -3.7% |
| Cons Non-Durable | 1.5% | 0.3% | -1.9% | -0.8% | -0.4% | -1.8% | 1.7% | -0.4% |
| Capital Goods | 5.3% | -4.0% | 0.9% | 7.9% | 3.9% | 4.1% | 7.9% | -8.2% |
| Intermediate Goods | 3.5% | -1.7% | -1.0% | 2.9% | 1.4% | 2.1% | 5.6% | -0.8% |
| All MFG-Sales | 4.0% | -2.2% | -0.3% | 5.4% | 2.6% | 2.2% | 5.2% | -3.6% |
by Louise Curley October 7, 2008
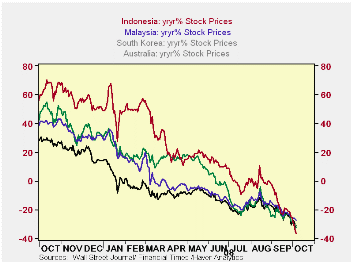 With
calls for lower interest rates in the Euro Area, the United States and
the United Kingdom and yesterday's steep cut of one percent in
Australia's base rate, the action of the Bank Indonesia in raising its
key interest rate twenty-five basis points to 9.5% seems perverse at
first glance. The stock market in Indonesia has suffered the same steep
declines that have occurred in most other countries. The first chart
shows the year- over- year change in Indonesian stock prices compared
with some of its neighbors: Australia, South Korea and
Malaysia. The latest figures show Indonesia lower than the
other three. · Perhaps the stock market is
just not that important in Indonesia. Using the ratio of
stock market capitalization to annual gross domestic as a measure of
the importance of the stock market in an economy, Indonesia comes out
pretty low.
With
calls for lower interest rates in the Euro Area, the United States and
the United Kingdom and yesterday's steep cut of one percent in
Australia's base rate, the action of the Bank Indonesia in raising its
key interest rate twenty-five basis points to 9.5% seems perverse at
first glance. The stock market in Indonesia has suffered the same steep
declines that have occurred in most other countries. The first chart
shows the year- over- year change in Indonesian stock prices compared
with some of its neighbors: Australia, South Korea and
Malaysia. The latest figures show Indonesia lower than the
other three. · Perhaps the stock market is
just not that important in Indonesia. Using the ratio of
stock market capitalization to annual gross domestic as a measure of
the importance of the stock market in an economy, Indonesia comes out
pretty low.
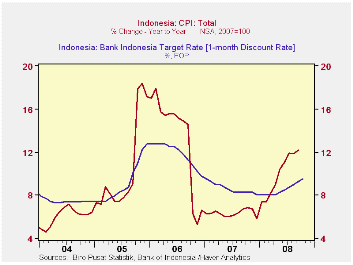
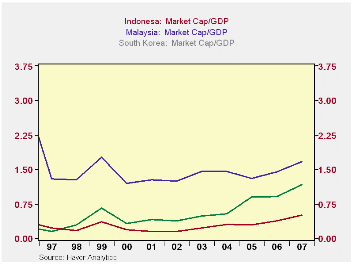
The second chart shows the ratio of market capitalization to GDP for South Korea, Malaysia and Indonesia. Indonesia's market capitalization was half its GDP in 2007, compared with a market capitalization of 1.7 times GDP in Malaysia and 1.2 times GDP in South Korea.· What is important to Bank Indonesia is the rate of inflation. The rate has been rising steadily since the beginning of this year and in September was just over 12%. The average rate of inflation for the nine months has been 9.9% compared with a target of 5% + or -1% for the year. The third chart shows the rate of inflation and Bank Indonesia's official interest rate.
| Indonesia | Malaysia | South Korea | Australia | |
|---|---|---|---|---|
| Stock Prices Y/Y % (Oct 7, 20 08) | -36.4 | -27.2 | -32.2 | -31.2 |
| Indonesia | Malaysia | South Korea | ||
| Market Cap/GDP (2007) | 0.50 | 1.67 | 1.16 | -- |
by Tom Moeller October 7, 2008
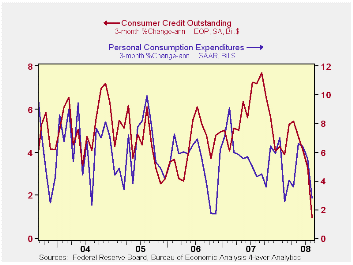
During August, consumer credit outstanding dropped as it never has before. The $7.9 billion m/m decline was by far the largest in the series' postwar history. On a percentage basis, credit outstanding did fall a more moderate 0.3%, but even that represented one of larger declines in the series' history. It is nearly unprecedented for a non-recessionary period.
Over the last three months, growth in consumer credit outstanding averaged just 1.0% (AR). Before August that growth averaged between 3% and 5% after the 2007 gain of 5.8%. The decline in growth was necessitated by less spending on consumer durables. The three month growth in nominal PCE for durable goods during the last three months cycled down to -12.4% from 2.9% positive growth during all of last year.
Non-revolving credit, which accounts for nearly two-thirds of
total consumer credit, led the decline in borrowing with a $7.3B drop.
Except for one month in early 1977, the dollar drop was unprecedented
and on a percentage basis the 0.5% decline was one of the larger ones.
On a three month basis, annualized growth fell to zero after a 4.7%
rise last year and 3.6% growth during 2006.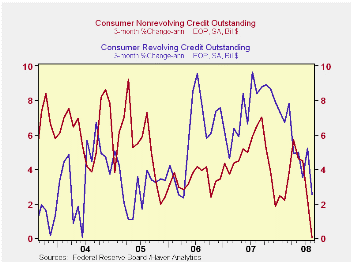
Revolving credit outstanding dropped a more modest $0.6B during August. While declines outside of past recessionary periods are rare, they are not unprecedented. And though they didn't exactly throw their credit cards away, consumers were much more frugal using them. Three month growth fell to 2.6%, down by two thirds from the 7.4% growth last year.
These figures are the major input to the Fed's Flow of Funds accounts for the household sector, released quarterly.
The minutes to the latest meeting of the FOMC can be found here.
| Consumer Credit (m/m Chg, SAAR) | August | July | Y/Y | 2007 | 2006 | 2005 |
|---|---|---|---|---|---|---|
| Total | $-7.9B | $5.2B | 3.8% | 5.8% | 4.5% | 4.3% |
| Revolving | $-0.6B | $4.0B | 5.7% | 7.4% | 6.1% | 3.1% |
| Non-revolving | $-7.3B | $1.2B | 2.7% | 4.7% | 3.6% | 4.9% |

Tom Moeller
AuthorMore in Author Profile »Prior to joining Haver Analytics in 2000, Mr. Moeller worked as the Economist at Chancellor Capital Management from 1985 to 1999. There, he developed comprehensive economic forecasts and interpreted economic data for equity and fixed income portfolio managers. Also at Chancellor, Mr. Moeller worked as an equity analyst and was responsible for researching and rating companies in the economically sensitive automobile and housing industries for investment in Chancellor’s equity portfolio. Prior to joining Chancellor, Mr. Moeller was an Economist at Citibank from 1979 to 1984. He also analyzed pricing behavior in the metals industry for the Council on Wage and Price Stability in Washington, D.C. In 1999, Mr. Moeller received the award for most accurate forecast from the Forecasters' Club of New York. From 1990 to 1992 he was President of the New York Association for Business Economists. Mr. Moeller earned an M.B.A. in Finance from Fordham University, where he graduated in 1987. He holds a Bachelor of Arts in Economics from George Washington University.
More Economy in Brief


