 Global| Jul 13 2009
U.S. Foreign Trade Activity:Recently A Smaller Share of U.S. GDP
by:Tom Moeller
|in:Economy in Brief
Summary
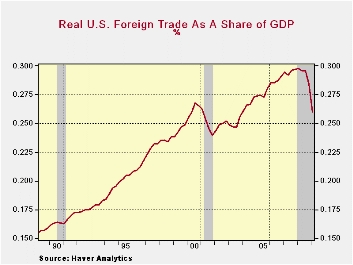
Until the current recession started, the U.S. level of foreign trade (exports PLUS imports) was rising sharply with the expansion of the worldwide economy. As a percentage of overall U.S. economic activity, trade was just shy of 30% [...]
 Until the current recession started, the U.S. level of foreign
trade (exports PLUS imports) was rising sharply with the expansion of
the worldwide economy. As a percentage of overall U.S. economic
activity, trade was just shy of 30% for roughly per year as economic
activity rose. Foreign trade's importance to the U.S. economy increased
from 25% of real GDP as recently as 2003 and it nearly doubled since
the early 1980s. It bares emphasizing that the total trade figures
matter because they not only reflect foreign demand for U.S.-made
products but the U.S. demand for products made elsewhere.
Until the current recession started, the U.S. level of foreign
trade (exports PLUS imports) was rising sharply with the expansion of
the worldwide economy. As a percentage of overall U.S. economic
activity, trade was just shy of 30% for roughly per year as economic
activity rose. Foreign trade's importance to the U.S. economy increased
from 25% of real GDP as recently as 2003 and it nearly doubled since
the early 1980s. It bares emphasizing that the total trade figures
matter because they not only reflect foreign demand for U.S.-made
products but the U.S. demand for products made elsewhere.
The data used for this analysis are the real foreign trade figures from the U.S. National Income and Product Accounts. These are available in Haver's USECON database.
 Since the recession began, the level of U.S. foreign trade has
contracted sharply. Trade's share of real GDP fell to 26%, a decline
back to the level of late-2003. These figures do not, of course,
reference the U.S. trade deficit which is more a function of the
foreign exchange value of the dollar and relative economic growth rates
in the U.S. versus those abroad. Though the U.S. employment figures do
not reflect the "substitution" effects of foreign for domestic workers,
clearly both groups have suffered from the reduced level of trade
activity.
Since the recession began, the level of U.S. foreign trade has
contracted sharply. Trade's share of real GDP fell to 26%, a decline
back to the level of late-2003. These figures do not, of course,
reference the U.S. trade deficit which is more a function of the
foreign exchange value of the dollar and relative economic growth rates
in the U.S. versus those abroad. Though the U.S. employment figures do
not reflect the "substitution" effects of foreign for domestic workers,
clearly both groups have suffered from the reduced level of trade
activity.
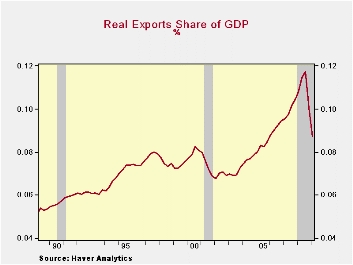
The recent decline in trade reflects both lower exports and imports. As an aside, the trade deficit recently fell sharply with the increase in U.S. competitiveness. The dollar's value fell 25% since 2001 and U.S. productivity surged. Behind the decline in trade is an 11.7% share that exports maintain of the U.S. economy. That's down from the 13.0% average for all of last year, however, it still roughly equals the share during all of 2006. More importantly, it's up from 10% in the mid-1990s and from 5%-to-6% in the '80s. In the early 1950s, exports accounted for just 3% of U.S. economic activity.
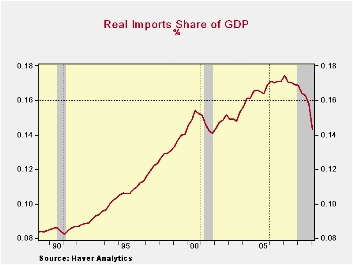
Imports have fallen to an even greater degree of late than exports; hence, the improvement in the real U.S. trade deficit. Imports fell to 14.3% of real GDP last quarter after the increase to a peak of 17.1% during 2007. Like exports, however, their presence in the economy has steadily surged. It's still up slightly from ten years ago and from 8% in the late- 1980s. In the early 1950s imports accounted for a miniscule 3% of U.S. economic activity.
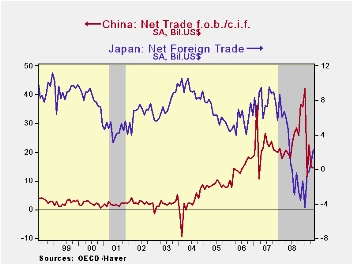
 Individual countries' trade figures give some background to
the trends addressed above. Overall, the huge increase in China's trade
surplus to $32B by the end of last year from a modest surplus as
recently as 2004 was driven by a ten-fold jump in exports from the
late-1990s. It fell slightly early this year. In Japan, exports last
year were up seven times from the early-1980s and the trade surplus had
been running a fairly stable, large $5 to $10B for twenty years.
However, that position collapsed to a deficit last year and continued
so early this year at -$2B. Germany's net foreign trade balance also
ballooned to a $22B surplus last year from $6B ten years earlier as
exports rose four-fold. The surplus fell back to $10 early in 2009.
Individual countries' trade figures give some background to
the trends addressed above. Overall, the huge increase in China's trade
surplus to $32B by the end of last year from a modest surplus as
recently as 2004 was driven by a ten-fold jump in exports from the
late-1990s. It fell slightly early this year. In Japan, exports last
year were up seven times from the early-1980s and the trade surplus had
been running a fairly stable, large $5 to $10B for twenty years.
However, that position collapsed to a deficit last year and continued
so early this year at -$2B. Germany's net foreign trade balance also
ballooned to a $22B surplus last year from $6B ten years earlier as
exports rose four-fold. The surplus fell back to $10 early in 2009.
These Main Economic Indicators from the OECD are available in Haver's OECDMEI database.
OECD's Gurría welcomes strengthening of G8/G5
dialogue through HAP from the OECD is available here.
| Foreign Trade | 1Q09 | 4Q08 | 3Q08 | 2008 | 2007 | 2006 |
|---|---|---|---|---|---|---|
| U.S. Trade Deficit % of Real GDP | 26.0 | 28.4 | 29.6 | 29.3 | 29.5 | 28.7 |
| Exports % Real GDP | 11.7 | 12.6 | 13.3 | 13.0 | 12.4 | 11.6 |
| Imports % Real GDP | 14.3 | 15.8 | 16.3 | 16.3 | 17.1 | 17.1 |
by Robert Brusca July 13, 2009
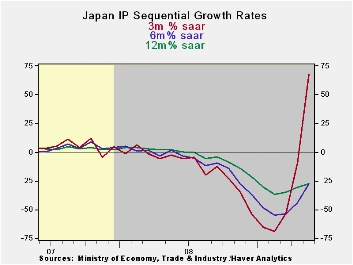
Japan’s consumer confidence is at a year and one half high.
The government has upgraded its economic assessment for the third month
in a row. Industrial output is on a tear. IP is up for three months in
a row. The past two month’s gains were on monthly increases of better
than 5.5% each. With the Yr/Yr month growth rate at -27.6%, over three
months Japan’s IP is up at an annualized pace of 67.8%.
Textiles, mining and investment goods are major groups with
declines over three months. It is interesting and telling that for
Japan investment goods output has lagged so badly. Despite high
unemployment virtually everywhere Japan’s consumer goods output is up
and investment goods output has been decaying. This month for the first
time in eight months investment goods output has rising on the month.
The business sector has been very hard hit by recession around the
globe. Although consumers have been hurt by unemployment and fears of
unemployment, consumer most consumers still hold their jobs. Some of
the displaced workers fallback on government programs and then there is
stimulus spending to try and prime the various economic pumps.
Maybe this month’s output increase of investment goods signals
that the forces of growth are finally going to include the business
sector and that investment projects have been cut back and postponed
all that is possible. But one observation is too thin a reed to seize.
For now we can only watch the output reports and look to the corporate
earnings reports that will probably remain downbeat. Whenever stirring
in the industrial sector is in progress in this cycle it seems to be
mild and small compared to past declines. Germany is showing some
stirring in its international business orders. Japan now has one-month
rise in investment goods output. We think the business sector will mark
time for a while longer and that the spread of the end-recession and
eventually of the recovery to investment goods is still a work in
progress that is lagging behind the consumer recovery.
| Japan Industrial Production Trends | ||||||||
|---|---|---|---|---|---|---|---|---|
| m/m % | Saar % | Yr/Yr | Qtr-2-Date | |||||
| Seasonally adjusted | May-09 | Apr-09 | Mar-09 | 3-mo | 6-mo | 12-mo | Yr-Ago | % AR |
| Mining&MFG | 5.7% | 5.9% | 1.6% | 67.8% | -27.8% | -27.6% | 2.3% | 35.2% |
| Total Industry | 5.8% | 5.4% | 1.3% | 63.1% | -27.0% | -26.8% | 2.2% | 31.7% |
| MFG | 5.5% | 5.9% | 1.7% | 66.9% | -28.0% | -27.7% | 2.2% | 35.5% |
| Textiles | -1.5% | 3.2% | -5.7% | -15.3% | -29.1% | -22.0% | -7.2% | -15.5% |
| T-port | 28.3% | 7.3% | 3.9% | 317.9% | -43.8% | -42.3% | 7.6% | 80.8% |
| Product Group | ||||||||
| Consumer Goods | 6.3% | 8.6% | 1.4% | 88.1% | -17.2% | -17.3% | 3.4% | 52.2% |
| Intermediate Goods | 7.6% | 9.5% | 3.4% | 120.4% | -27.6% | -29.7% | 4.5% | 75.3% |
| Investment Goods | 2.2% | -5.6% | -2.2% | -20.6% | -45.3% | -35.2% | -3.3% | -37.3% |
| Mining | -3.5% | 1.0% | -4.0% | -23.4% | -22.2% | -12.3% | -3.6% | -19.2% |
| Electric&Gas | 2.2% | -0.3% | -0.7% | 4.6% | -13.1% | -7.7% | 1.6% | -3.7% |
by Louise Curley July 13, 2009
 The
diffusion index of
Consumer Confidence among Japanese families of 2
or more persons was 37.6 in June, 5% above the May figure and
16% above the figure of June 2008. Although the index
indicates a low level of confidence, the index has been rising for the
past six months and is now 43% above the historically low level reached
last December, as can be seen in the first chart.
The
diffusion index of
Consumer Confidence among Japanese families of 2
or more persons was 37.6 in June, 5% above the May figure and
16% above the figure of June 2008. Although the index
indicates a low level of confidence, the index has been rising for the
past six months and is now 43% above the historically low level reached
last December, as can be seen in the first chart.
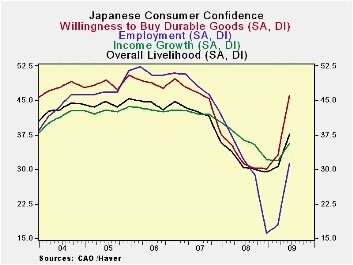
The second
chart shows the major factors that influence confidence. The
outlook for employment took a big jump in June, rising more than
16%.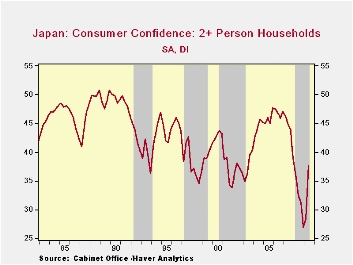 The improvement in the employment outlook and related
improvements in income growth and general livelihood, were, no doubt,
important reasons for the big increased in the willingness to buy
durable goods, which increased more than 10% in June and was almost 48%
above June 2008.
The improvement in the employment outlook and related
improvements in income growth and general livelihood, were, no doubt,
important reasons for the big increased in the willingness to buy
durable goods, which increased more than 10% in June and was almost 48%
above June 2008.
The improvement in consumer confidence together with the improvement in business confidence in the past week or so--rising leading and coincident indicators and the recent Tankan results--suggest at the very least that the Japanese economy is no longer declining.
| Japan: Consumer Confidence: 2 + Person Family (S.A. Diffusion Indexes) | June 09 | May 09 | June 08 | M/M % | Y/Y % | 2008 | 2007 | 2006 |
|---|---|---|---|---|---|---|---|---|
| Consumer Confidence | 37.6 | 34.5 | 32.5 | 8.88 | 15.69 | 32.7 | 44.1 | 46.9 |
| Overall Livelihood | 37.6 | 35.3 | 30.4 | 6.62 | 23.68 | 31.5 | 41.6 | 44.4 |
| Income Growth | 35.7 | 34.4 | 36.4 | 3.78 | -1.92 | 36.3 | 42.0 | 43.0 |
| Employment | 31.2 | 26.8 | 32.2 | 16.42 | -3.11 | 30.7 | 47.5 | 51.2 |
| Willingness to Buy Durable Goods | 46.1 | 41.8 | 31.2 | 10.38 | 47.76 | 32.3 | 45.4 | 49.0 |

Tom Moeller
AuthorMore in Author Profile »Prior to joining Haver Analytics in 2000, Mr. Moeller worked as the Economist at Chancellor Capital Management from 1985 to 1999. There, he developed comprehensive economic forecasts and interpreted economic data for equity and fixed income portfolio managers. Also at Chancellor, Mr. Moeller worked as an equity analyst and was responsible for researching and rating companies in the economically sensitive automobile and housing industries for investment in Chancellor’s equity portfolio. Prior to joining Chancellor, Mr. Moeller was an Economist at Citibank from 1979 to 1984. He also analyzed pricing behavior in the metals industry for the Council on Wage and Price Stability in Washington, D.C. In 1999, Mr. Moeller received the award for most accurate forecast from the Forecasters' Club of New York. From 1990 to 1992 he was President of the New York Association for Business Economists. Mr. Moeller earned an M.B.A. in Finance from Fordham University, where he graduated in 1987. He holds a Bachelor of Arts in Economics from George Washington University.
More Economy in Brief


