 Global| Mar 17 2009
U.S. Finished Goods PPI RisesModestly; "Downstream" Pricing Remains Weak
by:Tom Moeller
|in:Economy in Brief
Summary
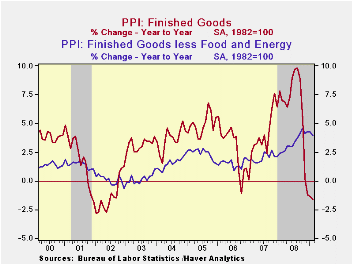
U.S. producer prices for finished goods increased a modest 0.1% last month. The slim gain offset last month's upside surprise of 0.8%, which was unrevised. Moreover, it contrasted with Consensus expectations for a 0.4% gain. Much of [...]
 U.S.
producer prices for finished goods increased a modest 0.1% last month.
The slim gain offset last month's upside surprise of 0.8%, which was
unrevised. Moreover, it contrasted with Consensus expectations for a
0.4% gain.
U.S.
producer prices for finished goods increased a modest 0.1% last month.
The slim gain offset last month's upside surprise of 0.8%, which was
unrevised. Moreover, it contrasted with Consensus expectations for a
0.4% gain.
Much of the reason for the latest moderation was a slimmer
0.2% rise in prices less food & energy which followed the
strong 0.4% January increase. A 0.1% has been expected. Prices of core
finished consumer goods rose 0.4% last month (4.1% y/y). Durable
consumer goods prices increased 0.2% (3.0% y/y) while core nondurable
goods prices increased another firm 0.5% (5.1% y/y). Finally, the gain
in monthly capital equipment prices eased to 0.1% after a 0.5% January
jump but the 3.7% increase y/y remained the strongest since 1991.· A
1.3% increase (-19.3% y/y) in finished energy prices moderated from the
3.7% rise during January. 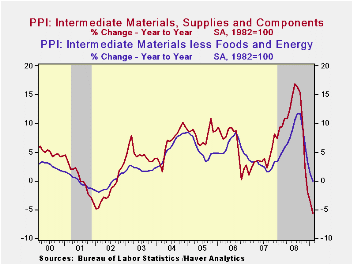 The rise in gasoline prices moderated to 8.7%
from a 15% spike in January (42.4% y/y) and home heating oil prices
reversed all of their January increase with a 7.2% decline (-46.4%
y/y). Natural gas prices fell 3.61% (-2.4% y/y).
The rise in gasoline prices moderated to 8.7%
from a 15% spike in January (42.4% y/y) and home heating oil prices
reversed all of their January increase with a 7.2% decline (-46.4%
y/y). Natural gas prices fell 3.61% (-2.4% y/y).
Prices for finished foods continued weak and they posted a 1.6% decline (+0.9% y/y), the third consecutive down month. The drop was led by lower meat (-3.8% y/y) and dairy product costs (-15.3% y/y).
Prices for intermediate goods continued downward and continued to hold promise for weaker finished goods prices. Intermediate goods prices fell 0.9% during February and are down 5.6% year-to-year, the weakest since 1949. Excluding food & energy, prices also were quite weak dropping 0.6%, the fifth consecutive monthly decline. The 0.1% y/y decline was the weakest comparison since 2002.
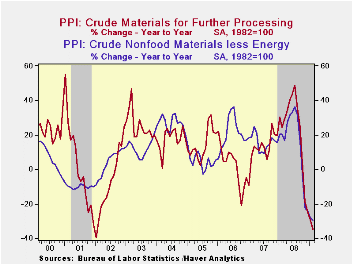 The crude
materials PPI
fell with the economy's loss of momentum. The 4.5% decline in the total
was led by an 8.5% drop (-48.3% y/y) in energy prices. Crude food
prices continued lower by 3.9% (-19.5% y/y) after the brief 1.0% rise
during January. Less food & energy, January crude prices rose
by 1.5% on the strength of higher metals prices.
The crude
materials PPI
fell with the economy's loss of momentum. The 4.5% decline in the total
was led by an 8.5% drop (-48.3% y/y) in energy prices. Crude food
prices continued lower by 3.9% (-19.5% y/y) after the brief 1.0% rise
during January. Less food & energy, January crude prices rose
by 1.5% on the strength of higher metals prices.
The Producer Price Index data is available in Haver's USECON database. More detailed data is in the PPI and in the PPIR databases.
Foreign Direct Investment, Productivity, and Country Growth: An Overview from the Federal Reserve Bank of St. Louis is available here.
| Producer Price Index (%) | February | January | Y/Y | 2008 | 2007 | 2006 |
|---|---|---|---|---|---|---|
| Finished Goods | 0.1 | 0.8 | -1.6 | 6.4 | 3.9 | 2.9 |
| Core | 0.2 | 0.4 | 3.9 | 3.4 | 2.0 | 1.5 |
| Intermediate Goods | -0.9 | -0.7 | -5.6 | 10.5 | 4.0 | 6.4 |
| Core | -0.6 | -1.1 | -0.1 | 7.6 | 2.8 | 6.0 |
| Crude Goods | -4.5 | -2.9 | -34.7 | 21.2 | 11.9 | 1.4 |
| Core | 1.5 | 0.1 | -29.4 | 15.0 | 15.6 | 20.8 |
by Tom Moeller March 17, 2009
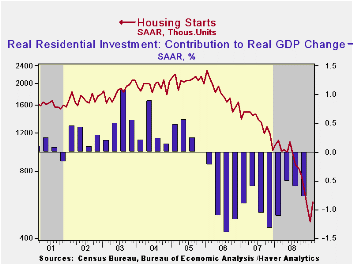
The severe downturn in housing starts took a breather last month as starts of multi-family homes nearly doubled. The Commerce Department indicated that total housing starts for February rose 22.2% from January to 583,000 (AR). January starts were revised up slightly and the latest figure compares to Consensus expectations for 450,000 starts.
Starts of multi-family homes rose 82.3%. That followed four consecutive months of sharp decline and returned starts to the highest level since October.
More indicative of the condition of the housing market is
starts of single-family homes. Though they rose 1.0% last month to
357,000 (AR), starts remained near the record low for the series which
dates back to 1959. The latest level is down eighty percent since the
peak in early 2006. Permits to build
single-family homes, a leading indicator of starts, rose
and reversed their January decrease. However, they remained off by more
than one-third over just the last three months. During the
last ten years, there has been an 84% correlation between the q/q
change in single-family starts and their contribution to quarterly GDP
growth.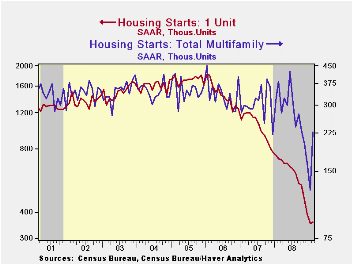
By region, starts of single-family units in the Northeast reversed their January collapse and rose by 54.2%. Nevertheless, that gain left them still off by nearly one half from the year ago level. Starts in the Midwest rose a lesser 12.8% (-51.8 % y/y) after their sharp 21.7% January falloff. In the South, starts also reversed the January decline and rose a modest 2.5% (-45.7% y/y). In the West, starts ran counter to the m/m trend in the rest of the country and fell by nearly one quarter (-62.7% y/y). That followed a slight January increase.
The housing starts figures can be found in Haver's USECON database.
Quick Exits of Subprime Mortgages from the Federal Reserve Bank of St. Louis is available here.
Facts and Myths about the Financial Crisis of 2008 from Federal Reserve Bank of Minneapolis is available here.
| Housing Starts (000s, SAAR) | February | January | December | Y/Y | 2008 | 2007 | 2006 |
|---|---|---|---|---|---|---|---|
| Total | 583 | 477 | 558 | -47.3% | 903 | 1,341 | 1,812 |
| Single-Family | 357 | 353 | 394 | -50.6 | 617 | 1,034 | 1,474 |
| Multi-Family | 226 | 124 | 164 | -41.3 | 286 | 307 | 338 |
| Building Permits | 547 | 531 | 547 | -44.2 | 880 | 1,389 | 1,844 |
by Tom Moeller March 17, 2009
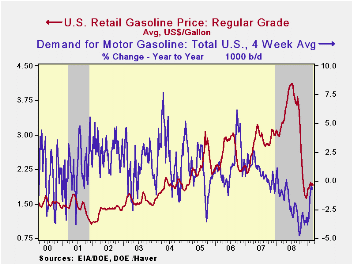
Regular gasoline prices dipped last week to $1.91 per gallon. That's at the bottom end of the $1.89 to $1.96 range in place since early February. Nevertheless the latest was up 30 cents from the December low. Yesterday, the spot market price for regular gasoline rose from Friday to $1.27 per gallon, up from $1.20 averaged last week. These prices compare to those that were slightly below $1.00 at the end of last year. The figures are reported by the U.S. Department of Energy.
Weekly gasoline prices can be found in Haver's WEEKLY database. Daily prices are in the DAILY database.
Gasoline demand has recovered due to the
earlier declines in prices. The latest y/y change of -0.8% moderated
from the 4.8% rate of decline seen last October. (Gasoline prices at
the time were just off their peak.) The change in demand is measured
using the latest four weeks versus the same four weeks in 2008. Demand
for all petroleum products was down 2.1% y/y after
the -8.0% comparison last October. These numbers are available in
Haver's OILWKLY database.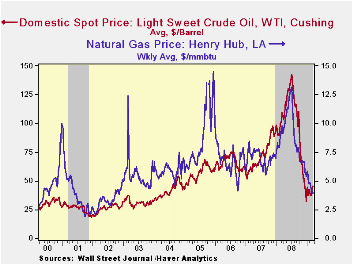
The rise in gasoline prices reflects the modest firming of crude oil prices. For a barrel of West Texas Intermediate crude oil, prices rose last week to $45.68, up 41% from the December low of $32.37 per barrel. Prices reached a high of $145.66 last July. In futures trading yesterday, the one-month price for crude oil rose even further to $47.35 per barrel.
The price of natural gas continued to slide last week with a sharp decline to $3.88 per mmbtu (-60.2% y/y), the lowest level since 2002. The latest average price was down more than two-thirds from the high reached in early-July of $13.19/mmbtu.
Changes in U.S. Family Finances from 2004 to 2007: Evidence from the Survey of Consumer Finances from the Federal Reserve Board can be found here.
| Weekly Prices | 03/16/09 | 03/09/09 | Y/Y | 2008 | 2007 | 2006 |
|---|---|---|---|---|---|---|
| Retail Regular Gasoline ($ per Gallon, Regular) | 1.91 | 1.94 | -41.8% | 3.25 | 2.80 | 2.57 |
| Light Sweet Crude Oil, WTI ($ per bbl.) | 45.68 | 43.26 | -58.3% | 100.16 | 72.25 | 66.12 |
by Louise Curley March 17, 2009
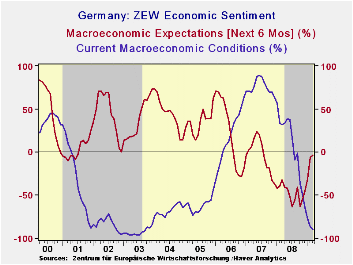 The German investors and
analysts who participated in the ZEW
survey conducted between March 2 and March 16, were slightly less
pessimistic about expectations six months ahead and slightly more
pessimistic about current conditions. The excess of pessimists over
optimists regarding the outlook declined from 5.8% in February to 3.5%
in March, while the excess of pessimists regarding current conditions
increased from 86.2% in February to 89.4% in March.
The German investors and
analysts who participated in the ZEW
survey conducted between March 2 and March 16, were slightly less
pessimistic about expectations six months ahead and slightly more
pessimistic about current conditions. The excess of pessimists over
optimists regarding the outlook declined from 5.8% in February to 3.5%
in March, while the excess of pessimists regarding current conditions
increased from 86.2% in February to 89.4% in March. 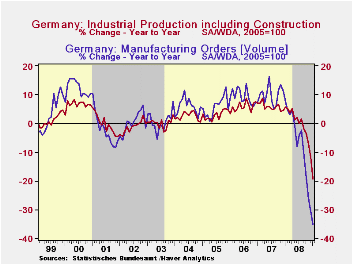 The percent
balances on current conditions and expectations are shown in the first
chart.
The percent
balances on current conditions and expectations are shown in the first
chart.
The release of the January data for new orders in
manufacturing and industrial production during the period of the
survey, provided little evidence that current economic conditions were
improving. Industrial production fell 7.5% in the month of January and
new orders were down 8.0%. The year over year declines in new orders
and industrial production, shown in the second chart, are significantly
greater than those of the last recession.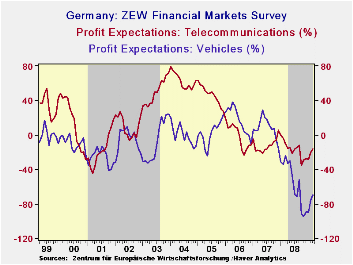
The reduction from 2% to 1.5% in its key interest rate by the European Central Bank on March 5 may have played a role in the slight improvement in the participants expectations of the outlook six months ahead. And the stock market stopped declining. From March 2 to March 16, the Frankfurt Xetra Dax Index rose 9%.
| GERMANY | Mar 09 | Feb 09 | Jan 09 | Dec 08 | Nov 08 | Oct O8 | Sep 08 |
|---|---|---|---|---|---|---|---|
| ZEW SURVEY (% balance) | |||||||
| Current Conditions | -89.4 | -86.2 | -77.1 | -64.5 | -50.4 | -35.9 | -1.0 |
| Expectations 6 months ahead | -3.5 | -5.8 | -31.0 | -45.2 | -53.5 | -63.0 | -41.1 |
| Profit Expectations Telecommunications | -16.1 | -20.2 | -28.3 | -27.7 | -29.7 | -35.7 | -12.1 |
| Profit Expectations Vehicle/Car | -70.2 | -75.3 | -90.3 | -89.3 | -94.6 | -91.7 | -51.7 |
| Industrial Production (Y/Y %) | N. A. | N. A. | -19.24 | -11.58 | -7.25 | -3.53 | -1.50 |
| New Orders Manufacturing (Y/Y %) | N. A. | N. A. | -35.11 | -30.5 | -26.07 | -18.80 | -9.80 |

Tom Moeller
AuthorMore in Author Profile »Prior to joining Haver Analytics in 2000, Mr. Moeller worked as the Economist at Chancellor Capital Management from 1985 to 1999. There, he developed comprehensive economic forecasts and interpreted economic data for equity and fixed income portfolio managers. Also at Chancellor, Mr. Moeller worked as an equity analyst and was responsible for researching and rating companies in the economically sensitive automobile and housing industries for investment in Chancellor’s equity portfolio. Prior to joining Chancellor, Mr. Moeller was an Economist at Citibank from 1979 to 1984. He also analyzed pricing behavior in the metals industry for the Council on Wage and Price Stability in Washington, D.C. In 1999, Mr. Moeller received the award for most accurate forecast from the Forecasters' Club of New York. From 1990 to 1992 he was President of the New York Association for Business Economists. Mr. Moeller earned an M.B.A. in Finance from Fordham University, where he graduated in 1987. He holds a Bachelor of Arts in Economics from George Washington University.
More Economy in Brief


