 Global| Mar 23 2006
U.S. Existing Home Sales Up
by:Tom Moeller
|in:Economy in Brief
Summary
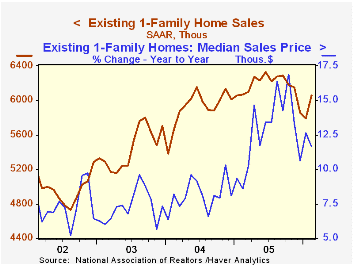
The National Association of Realtors reported that total existing home sales rose 5.2% m/m to 6.910M last month following a 2.7% January decline that was about half the drop initially estimated. Consensus expectations had been for [...]
The Road to Price Stability from the Federal Reserve Board can be found here.
| Existing Home Sales (000, AR) | Feb | Jan | Y/Y | 2005 | 2004 | 2003 |
|---|---|---|---|---|---|---|
| Total Home Sales | 6,910 | 6,570 | -0.3% | 7,064 | 6,722 | 6,176 |
| Single Family Home Sales | 6,060 | 5,790 | -0.2% | 6,170 | 5,912 | 5,443 |
| Single Family Median Home Price ($,000) | $208.5 | $209.6 | 11.6% | $206.3 | $182.8 | $169.1 |
by Tom Moeller March 23, 2006
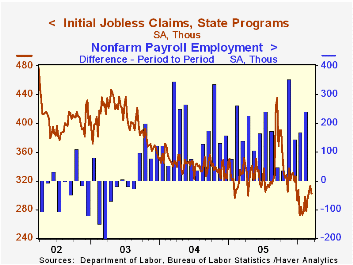
Last week, initial claims for unemployment insurance reversed all of the upwardly revised increase the prior period. The 11,000 person decline to 302,000 compared with Consensus expectations for 305,000 claims.
The latest figure covers the survey period for March nonfarm payrolls and claims rose 24,000 (8.6%) from the February period.
During the last ten years there has been a (negative) 75% correlation between the level of initial jobless insurance claims and the m/m change in payroll employment.
The four-week moving average of initial claims rose to 303,500 (-7.3% y/y), its highest level since early January.
Continuing unemployment insurance claims reversed most of the prior week's sharp drop, which was revised deeper, and rose 38,000 to 2.472M.
The insured rate of unemployment was stable at 1.9% for the sixth week.
Using Cyclical Regimes of Output Growth to Predict Jobless Recoveries from the Federal Reserve Bank of St. Louis is available here.
Also from the St. Louis Fed is Entrepreneurship and the Policy Environment and the article can be found here.
| Unemployment Insurance (000s) | 03/18/06 | 03/11/06 | Y/Y | 2005 | 2004 | 2003 |
|---|---|---|---|---|---|---|
| Initial Claims | 302 | 313 | -8.5% | 332 | 343 | 402 |
| Continuing Claims | -- | 2,472 | -7.6% | 2,663 | 2,924 | 3,532 |
by Tom Moeller March 23, 2006
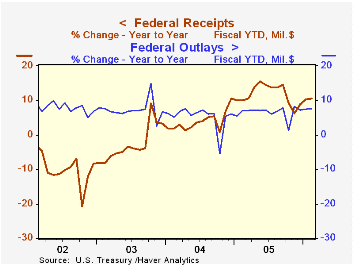
The U.S. federal government posted a deeper budget deficit during February of $119.2B versus last February's deficit of $113.9B. Nevertheless, the fiscal year to date budget deficit narrowed to $217.5B versus 223.4B during the first five months of FY05.
Net revenues collapsed 50.9% m/m as is often the case during February but rose 10.5% during the first five months versus FY04. Individual income tax receipts (44% of total receipts) rose 10.8% y/y and corporate income taxes (10% of total receipts) rose 29.6% y/y during fiscal year 2005's first five months.
The improved job market raised employment taxes (36% of total receipts) 6.0% y/y though estate & gift taxes fell 0.4% y/y.
U.S. net outlays continued strong and rose 7.6% y/y fiscal year to date. Defense (19% of total outlays) for the first five months of FY06 rose 7.6% from the year prior. The growth in Medicare spending (12% of total outlays) accelerated to 8.5% y/y and spending on social security (21% of total outlays) grew 5.6%. s
Agriculture spending grew 10.6%. Also strong was spending on community & regional development which nearly tripled this fiscal year to date versus last. Spending on health programs (10% of the total) rose 2.1% while spending on education & training (4% of the total) fell 1.9% y/y. Interest expense (8% of the total) grew 24.3% with higher interest rates.
The Current Budget Projections from the US Congressional Budget Office released March 3rd are available here.
| US Government Finance | Feb | Jan | Y/Y | FY 2005 | FY 2004 | FY 2003 |
|---|---|---|---|---|---|---|
| Budget Balance | $-119.2B | $21.0B | $-113.9B (2/05) | $-318.3B | $-412.7B | $-377.6B |
| Net Revenues | $112.9B | $230.0B | 11.9% | 14.5% | 5.5% | -3.8% |
| Net Outlays | $232.1B | $209.0B | 8.0% | 7.8% | 6.2% | 7.4% |
by Carol Stone March 23, 2006
Besides its wide array of macroeconomic databases, Haver Analytics also features a number of industry offerings. Just this morning, for example, Chemical Week magazine released its weekly report on chemical prices. These are maintained in Haver's CHEMWEEK database. Far from being esoteric trivia, the chemicals in this collection are main building blocks of products and fuels consumers use every day. If not ingredients in the items themselves, several of these chemicals are important in the manufacturing process.
The database consists of 29 major chemicals. We list just four in the table below as a sampling. The prices we show here averages; "highs" and "lows" are also available. These are US spot prices; spot prices are also given for European markets and contract prices for several specific delivery months are available for most items for both US and European markets.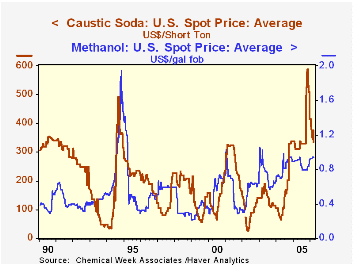
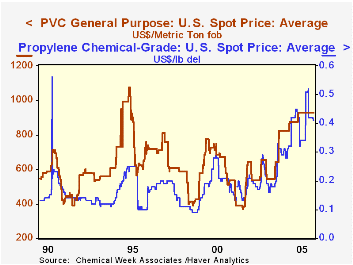
The particular items we show here are multipurpose chemicals. Many plastics are made from polyvinyl chloride and combinations of propylene with various other substances. Both have experienced a near doubling over the past couple of years, but have shown some signs of stabilizing so far this year. PVC is a hard plastic, frequently used now in pipes, as in household plumbing, and other building products, such as vinyl siding. Its price has been steady now since last April at $930 per metric ton. However, the price rose in steep steps from just $370/MT in early 2002.
Propylene is an ingredient in other products, such as aerosol sprays, other plastics and fibers and synthetic rubber. Its price has more than tripled since early 2002, when it traded at just $0.13/pound, compared with as much as $0.52 briefly in late November and $0.41 most currently.
Methanol, or wood alcohol, was once thought to be a potential substitute or complement to gasoline in motor vehicle fuels. Racecars and some specialty vehicles do run on it. However, it is also highly toxic, causing safety concerns. So other items, such as ethanol, are developing more as alternative fuels. This shift in potential usage may be reflected in the price trend for methanol. It has risen markedly, from $0.57/gallon in late 2003 to $0.94 recently, but on a relative basis, it has moved much less than other chemicals, as is evident in the second graph.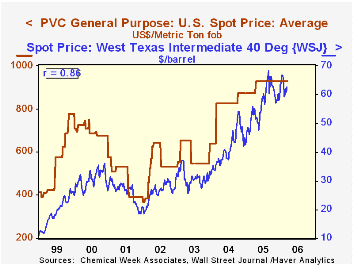
Finally, the price of caustic soda is also up dramatically. Caustic soda is more familiarly known as lye and its more formal chemical name is sodium hydroxide. It is a very widely used in the manufacture of such diverse items as aluminum, textiles, soap and paper and in petroleum refining. As recently as the spring of 2004, this key substance was selling for as little as $65 a ton. But in November, it reached $587.50 before falling back to "just" $335 in the last couple of weeks.
The mere wide ranges covered by these price movements highlight the value of the CHEMWEEK database. Unlike many commodities that have tighter markets, these chemical prices often seem to move in fits and spurts, sometimes doubling virtually "overnight". So monitoring them would seem vital for industry analysts and even macroeconomists.
Further, several are closely tied to petroleum prices. In the third graph, for instance, we show the simple spot price for crude oil, West Texas Intermediate, from the WEEKLY and OILWKLY databases. It has a high 86% correlation with PVC prices since 1999 and as high or for even longer periods with numerous other chemicals. So the role of oil is closely intertwined not only with heating and driving costs, but also with the raw material and processing costs for many other products.
| US Spot Prices | Mar 22, 2006 | Feb 22, 2006 | End-Dec 2005* | 2005 | 2004 | 2003 |
|---|---|---|---|---|---|---|
| PVC General Purpose, $/metric ton | 930 | 930 | 930 | 914 | 810 | 585 |
| Propylene, Chemical Grade, $/lb | 0.41 | 0.41 | 0.42 | 0.41 | 0.31 | 0.20 |
| Methanol, $/gal | 0.94 | 0.94 | 0.91 | 0.86 | 0.82 | 0.73 |
| Caustic Soda, $/short ton | 335 | 345 | 415 | 369 | 176 | 139 |
| Memo: Crude Oil, $/bbl** | 62.69 | 60.00 | 59.49 | 56.29 | 41.31 | 31.14 |

Tom Moeller
AuthorMore in Author Profile »Prior to joining Haver Analytics in 2000, Mr. Moeller worked as the Economist at Chancellor Capital Management from 1985 to 1999. There, he developed comprehensive economic forecasts and interpreted economic data for equity and fixed income portfolio managers. Also at Chancellor, Mr. Moeller worked as an equity analyst and was responsible for researching and rating companies in the economically sensitive automobile and housing industries for investment in Chancellor’s equity portfolio. Prior to joining Chancellor, Mr. Moeller was an Economist at Citibank from 1979 to 1984. He also analyzed pricing behavior in the metals industry for the Council on Wage and Price Stability in Washington, D.C. In 1999, Mr. Moeller received the award for most accurate forecast from the Forecasters' Club of New York. From 1990 to 1992 he was President of the New York Association for Business Economists. Mr. Moeller earned an M.B.A. in Finance from Fordham University, where he graduated in 1987. He holds a Bachelor of Arts in Economics from George Washington University.
More Economy in Brief


