 Global| Aug 23 2006
U.S. Existing Home Sales Down
by:Tom Moeller
|in:Economy in Brief
Summary
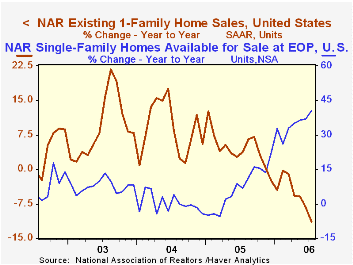
The National Association of Realtors reported that total existing home sales fell 4.1% during July to 6.330M, the fourth consecutive m/m decline. The decline compared to Consensus expectations for a lesser decline to 6.55M. Sales of [...]
Reflections on monetary policy: Flexibility, transparency and inflation from the Federal Reserve Bank of Chicago is available here.
| Existing Home Sales (000, AR) | July | June | Y/Y | 2005 | 2004 | 2003 |
|---|---|---|---|---|---|---|
| Total Home Sales | 6,330 | 6,600 | -11.2% | 7,064 | 6,722 | 6,176 |
| Single Family Home Sales | 5,510 | 5,800 | -11.4% | 6,170 | 5,912 | 5,443 |
| Single Family Median Home Price (000) | $231.2 | $230.1 | 1.5% | $217.5 | $192.8 | $178.3 |
by Tom Moeller August 23, 2006
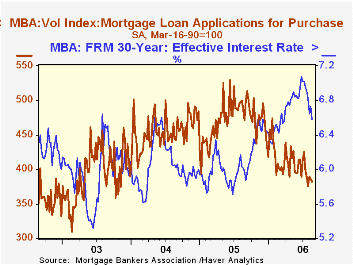
The total number of mortgage applications ticked up 0.1% last week after firms gains during the prior two weeks. As a result of the earlier increases, the average level of applications in August is up 3.0% from July.
Again, recent gains were led by higher applications to refinance which rose 1.3% for the fifth consecutive weekly increase. Refis in August are 12.6% higher than in July.
Moving in the other direction, purchase applications fell 1.0% last week for the fifth decline in the last six weeks. Purchase apps in August are 2.9% below the July average.
During the last ten years there has been a 58% correlation between the y/y change in purchase applications and the change in new plus existing single family home sales.
The effective interest rate on a conventional 30-year mortgage fell sharply to 6.58% from 6.73% the prior week. The peak for 30 year financing was 7.08% late in June. The rate on 15-year financing also fell ten basis points to 6.32% and the peak rate was 6.75%. Interest rates on 15 and 30 year mortgages are closely correlated (>90%) with the rate on 10 year Treasury securities.
During the last ten years there has been a (negative) 79% correlation between the level of applications for purchase and the effective interest rate on a 30-year mortgage.
The Mortgage Bankers Association surveys between 20 to 35 of the top lenders in the U.S. housing industry to derive its refinance, purchase and market indexes. The weekly survey accounts for more than 40% of all applications processed each week by mortgage lenders. Visit the Mortgage Bankers Association site here.
A Trend and Variance Decomposition of the Rent-Price Ratio in Housing Markets
from the Federal Reserve Board can be found here.
| MBA Mortgage Applications (3/16/90=100) | 08/18/06 | 08/11/06 | Y/Y | 2005 | 2004 | 2003 |
|---|---|---|---|---|---|---|
| Total Market Index | 561.5 | 561.2 | -25.7% | 708.6 | 735.1 | 1,067.9 |
| Purchase | 382.2 | 385.9 | -21.7% | 470.9 | 454.5 | 395.1 |
| Refinancing | 1,608.5 | 1,587.5 | -30.5% | 2,092.3 | 2,366.8 | 4,981.8 |
by Tom Moeller August 23, 2006
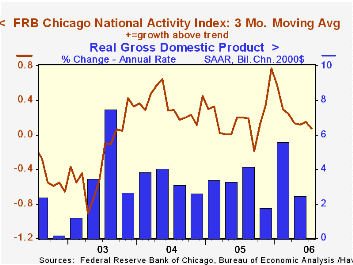
At -0.12 for July, the National Activity Index (CFNAI) from the Federal Reserve Bank of Chicago was negative for the second month in the last three. Moreover, the three-month moving average of the CFNAI fell to 0.07, its lowest level in over a year.
A zero value of the CFNAI indicates that the economy is expanding at its historical trend rate of growth and during the last twenty years there has been a 68% correlation between the level of the CFNAI and q/q growth in real GDP.
The CFNAI is a weighted average of 85 indicators of economic activity. The indicators reflect activity in the following categories: production and income, the labor market, personal consumption and housing, manufacturing and trade sales, and inventories & orders.
The latest CFNAI report is available here.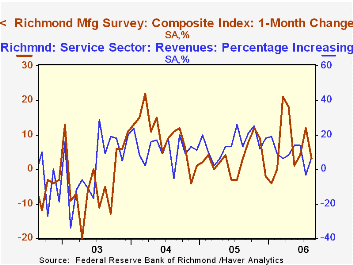
The Federal Reserve Bank of Richmond reported that its August Composite Index from the manufacturing survey at 3 was at its lowest level since May. During the last ten years there has been a 38% correlation between the diffusion index level and the one month change in U.S. manufacturing industrial production. The August report can be found here.
The Richmond Fed's survey of the service sector, conversely, improved. In August, the percentage of firms reporting increasing revenues returned to positive territory and the percentage of employees was at its highest in a year. The latest report is available here.
| Chicago Fed | July | June | July '05 | 2005 | 2004 | 2003 |
|---|---|---|---|---|---|---|
| CFNAI | -0.12 | 0.43 | 0.10 | 0.20 | 0.35 | -0.15 |
by Tom Moeller August 23, 2006
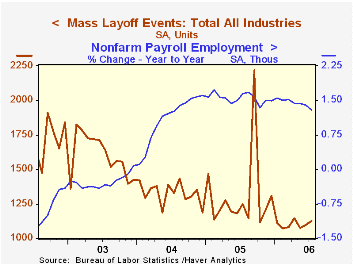
The number of mass layoff events in July increased 2.6% after a 2.1% gain during June. Despite the increases, layoff events during the first seven months of 2006 remained down 11.4% from the year earlier period.
During the last ten years there has been a (negative) 85% correlation between the three month average level of layoff announcements and the y/y change in payroll employment.
The number of persons affected in July by mass layoffs fell 4.0% m/m and were 14.4% lower during the first seven months of 2006 versus last year.
Increased layoffs in manufacturing (-3.6% y/y) and in real estate (-17.4% y/y) dominated the increase in claimants for unemployment last month. Declines elsewhere were widespread.
The Mass Layoff Statistics (MLS) program collects reports on mass layoff actions that result in workers being separated from their jobs. Monthly mass layoff numbers are from establishments which have at least 50 initial claims for unemployment insurance (UI) filed against them during a 5-week period.
| Mass Layoffs | July | June | Y/Y | 2005 | 2004 | 2003 |
|---|---|---|---|---|---|---|
| All US Industries (# Events, SA) | 1,125 | 1,097 | -9.9% | 15,699 | 15,926 | 19,220 |
| Total (# Persons, SA) | 114,895 | 119,662 | -12.4% | 1,722,452 | 1,591,081 | 1,946,548 |
by Carol Stone August 23, 2006
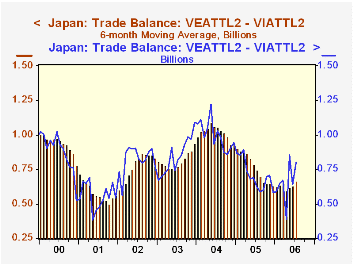
Japan's trade balance appears to have stabilized after a surge in petroleum imports cut it back last year. In July, the balance was ¥800 billion, up from ¥624 billion a year ago and an average of ¥726 billion for 2005. Obviously, though, as the three months of data in the table below show, the balance moves around a good bit. But a six-month moving average makes the stabilization clearer, as illustrated in the first graph.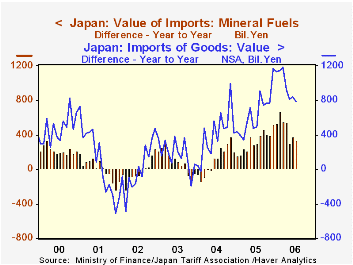
The role of fuels imports in the erosion of the traditionally sizable Japanese trade surplus is indicated in the second graph. Since late 2004, right at half of the year-on-year yen increase in imports has come from "mineral fuels". No other single major category has a significant share of the growth. At the same time, both petroleum and total imports have leveled out in the last few months, easing the pressure on the trade balance.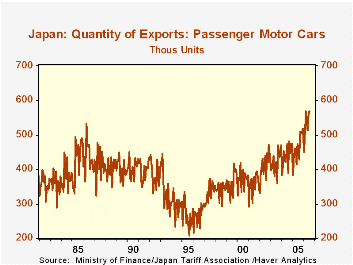
Exports have also helped the trade balance. Also a bit erratic from month-to-month, foreign sales have picked up, with a 14.2% increase on the last year, nearly double the average growth in 2005. Several sectors have contributed, with good gains in machinery, non-automotive transport equipment and "other" exports. However, the biggest increase has been in motor vehicles, which are up a whopping 26.2% in July from July 2005. Details from the Ministry of Finance show that the number of passenger cars exported was a record last month, 569,000. This is an extraordinary development. The last time figures were nearly as high was in the mid-1980s, as seen in graph 3. At that time, Japanese makers produced a relatively small number of their cars in the US compared to the present and until just the last few months, truck sales have dominated motor vehicle demand, at least in the US. The move back to more fuel-efficient cars is well along, giving an ironic boost to the Japanese trade surplus.
| Japan, Bil.¥, Seas Adj.* | July 2006 | June 2006 | May 2006 | July 2005 | Monthly Averages|||
|---|---|---|---|---|---|---|---|
| 2005 | 2004 | 2003 | |||||
| Trade Balance | 800 | 639 | 854 | 624 | 726 | 996 | 849 |
| Exports | 6335 | 6139 | 6124 | 5410 | 5471 | 5097 | 4546 |
| % Change | 3.2 | 0.2 | 1.3 | 14.2 | 7.3 | 12.1 | 4.7 |
| Imports | 5535 | 5499 | 5271 | 4786 | 4746 | 4101 | 3697 |
| % Change | 0.6 | 4.3 | -6.9 | 16.8 | 15.7 | 10.9 | 5.1 |

Tom Moeller
AuthorMore in Author Profile »Prior to joining Haver Analytics in 2000, Mr. Moeller worked as the Economist at Chancellor Capital Management from 1985 to 1999. There, he developed comprehensive economic forecasts and interpreted economic data for equity and fixed income portfolio managers. Also at Chancellor, Mr. Moeller worked as an equity analyst and was responsible for researching and rating companies in the economically sensitive automobile and housing industries for investment in Chancellor’s equity portfolio. Prior to joining Chancellor, Mr. Moeller was an Economist at Citibank from 1979 to 1984. He also analyzed pricing behavior in the metals industry for the Council on Wage and Price Stability in Washington, D.C. In 1999, Mr. Moeller received the award for most accurate forecast from the Forecasters' Club of New York. From 1990 to 1992 he was President of the New York Association for Business Economists. Mr. Moeller earned an M.B.A. in Finance from Fordham University, where he graduated in 1987. He holds a Bachelor of Arts in Economics from George Washington University.
More Economy in Brief


