 Global| Jun 07 2013
U.S. Employment Growth and Unemployment Rate Rise a Bit
by:Tom Moeller
|in:Economy in Brief
Summary
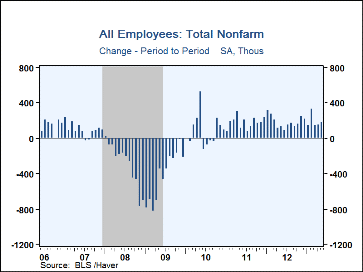
Nonfarm payroll employment increased 175,000 (1.6% y/y) during May. That followed revised gains of 149,000 and 142,000 during the prior two months, earlier reported as 165,000 and 138,000, respectively. Consensus expectations were for [...]
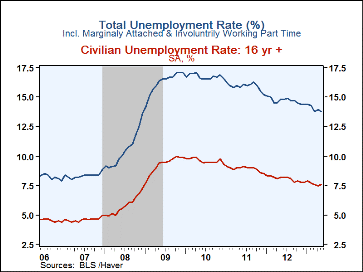
Nonfarm payroll employment increased 175,000 (1.6% y/y) during May. That followed revised gains of 149,000 and 142,000 during the prior two months, earlier reported as 165,000 and 138,000, respectively. Consensus expectations were for a 170,000 increase. Job growth in the construction and service industries accounted for the rise in payrolls last month. May's unemployment rate ticked up to 7.6% but remained near the cycle low. An unchanged 7.5% rate had been expected. The jobless rate on the broadest measure of unemployment, which includes marginally attached & those involuntarily working part-time, slipped m/m to the recovery low of 13.8%.
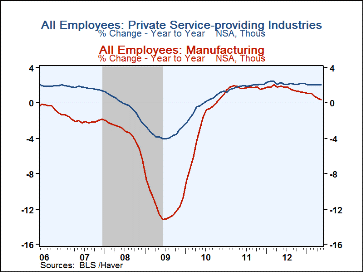
From the establishment survey of employment, the 175,000 increase (1.6% y/y) in jobs was the strongest since February. Over three-months, the average increase fell to 155,000, its weakest since last October. Weakness in factory sector job growth continued. Last month's 8,000 worker decline (+0.3% y/y) was the third consecutive monthly drop. Construction sector payrolls, however, gained a modest 7,000 (3.5% y/y). Here too, the three-month average increase of 7,000 was the weakest since September. To the upside, private service sector jobs rose 179,000 (2.1% y/y). But over a three-month period, the rise here was the softest since October, finishing the picture of moderating job growth.
Amongst private service industries, health care & social services jobs rose 11,800 (2.0% y/y). Retail sector jobs grew 27,700 (1.7% y/y) but these two areas finished a dramatic three-month growth slowdown from the late-2012 peak. Professional and business service jobs grew 57,000 (3.3% y/y) and leisure & hospitality jobs rose 43,000 (3.0% y/y). In these two areas, three-month job growth remained near the cycle peak. Education services jobs rose 14,200 (0.8% y/y) and three-month job growth reached a new cycle peak. Jobs in the government sector fell 3,000 (-0.3% y/y) last month. The three month decline of 8,000 is improved from the three-month average decline of 193,000 during the summer of 2010.
The breadth of job growth picked up a bit to 59.8%. Over a three-month span, however, the breath of job increase fell to an eight-month low of 60.3%. In the factory sector, the one-month breadth of job change was a less than break-even 45.7% and over a three-month period it was 46.9%.
In sympathy with modest employment growth, the length of the average workweek was unchanged at 34.5 hours. That's just equal to the Q1 average but up from the 34.3 hours low in October. The rise in employment and the stability of hours left the index of aggregate hours worked up just slightly month-to- month. So far in Q2, the gain is a 1.4% annual rate following the 3.6% Q1 advance.
From the household sector employment survey, the unemployment rate ticked up m/m to 7.6% but that remained down sharply from the October 2009 high of 10.0%. The total unemployment rate, including those who are marginally attached or involuntarily working part time, slipped to 13.8%, down from 17.1% at its peak. The average duration of unemployment fell m/m to 17.3 weeks versus 24.8 weeks at the peak in 2010.
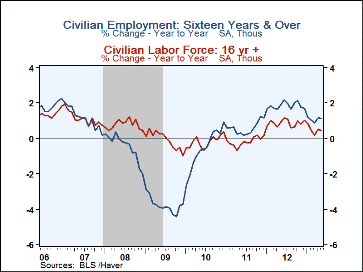
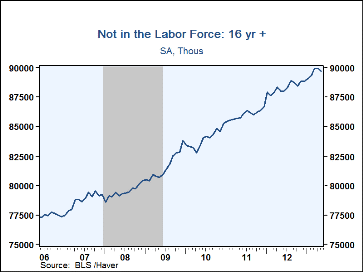
The unemployment rate's slip reflected 319,000 rise (1.1% y/y) in employment and a 420,000 increase (0.4% y/y) in the labor force. The labor force participation rate nudged up m/m to 63.4% but remained below the Q1 average of 63.5%. These rates compare to 67.1% averaged from 1997 to 2000. The number of those not in the labor force grew 2.0% y/y, down from the 2.9% growth in 2010.
The figures referenced above are available in Haver's USECON database. Additional detail can be found in the LABOR and in the EMPL databases. The expectation figures are from Action Economics and are in the AS1REPNA database.
Estimating the Trend in Employment Growth from the Federal Reserve Bank of Chicago is available here.
| Employment: (M/M Chg., 000s) | May | Apr | Mar | Y/Y | 2012 | 2011 | 2010 |
|---|---|---|---|---|---|---|---|
| Payroll Employment | 175 | 149 | 142 | 1.6% | 1.7% | 1.2% | -0.7% |
| Previous | -- | 165 | 138 | -- | 1.4 | 1.2 | -0.7 |
| Manufacturing | -8 | -9 | -4 | 0.3 | 1.7 | 1.7 | -2.7 |
| Construction | 7 | -2 | 16 | 3.4 | 2.0 | 0.3 | -8.3 |
| Private Service Producing | 179 | 172 | 140 | 2.1 | 2.2 | 1.9 | -0.1 |
| Government | -3 | -8 | -12 | -0.3 | -0.8 | -1.8 | -0.3 |
| Average Weekly Hours - Private Sector | 34.5 | 34.5 | 34.6 | 34.4 (May'12) |
34.4 | 34.4 | 34.1 |
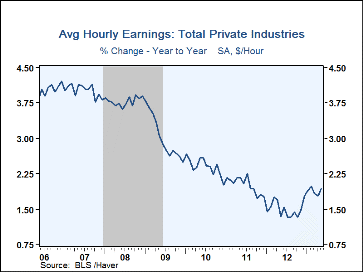
| Average Private Sector Hourly Earnings (%) | 0.0 | 0.1 | 0.0 | 1.9 | 1.5 | 2.0 | 2.4 |
| Unemployment Rate (%) | 7.6 | 7.5 | 7.6 | 8.2 (May'12) |
8.1 | 8.9 | 9.6 |
Tom Moeller
AuthorMore in Author Profile »Prior to joining Haver Analytics in 2000, Mr. Moeller worked as the Economist at Chancellor Capital Management from 1985 to 1999. There, he developed comprehensive economic forecasts and interpreted economic data for equity and fixed income portfolio managers. Also at Chancellor, Mr. Moeller worked as an equity analyst and was responsible for researching and rating companies in the economically sensitive automobile and housing industries for investment in Chancellor’s equity portfolio. Prior to joining Chancellor, Mr. Moeller was an Economist at Citibank from 1979 to 1984. He also analyzed pricing behavior in the metals industry for the Council on Wage and Price Stability in Washington, D.C. In 1999, Mr. Moeller received the award for most accurate forecast from the Forecasters' Club of New York. From 1990 to 1992 he was President of the New York Association for Business Economists. Mr. Moeller earned an M.B.A. in Finance from Fordham University, where he graduated in 1987. He holds a Bachelor of Arts in Economics from George Washington University.
More Economy in Brief
 Global| Feb 05 2026
Charts of the Week: Balanced Policy, Resilient Data and AI Narratives
by:Andrew Cates


