 Global| Mar 27 2006
U.S. Durable Goods Orders Up, But ...
by:Tom Moeller
|in:Economy in Brief
Summary
New orders for durable goods increased 2.6% last month following an 8.9% drop during January that was somewhat shallower than initially reported. The gain outpaced Consensus expectations for a 1.0% increase, however, unlike the prior [...]
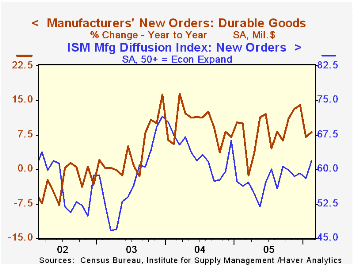
New orders for durable goods increased 2.6% last month following an 8.9% drop during January that was somewhat shallower than initially reported. The gain outpaced Consensus expectations for a 1.0% increase, however, unlike the prior month's report covering activity in the factory sector, the details were not constructive.
During the last ten years there has been a 51% correlation between the y/y change in durable goods orders and the level of the ISM orders index.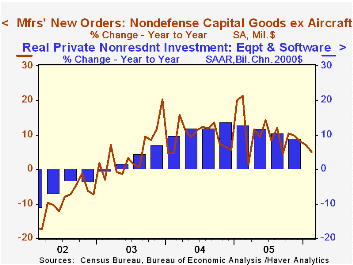
A 26.0% rebound in aircraft & parts orders predominated last month's gain. It followed a 59.9% January plunge and was led by a 52.5% surge in nondefense (66.3% y/y) aircraft.
New orders for motor vehicles & parts fell for the fourth month in the last five and the 3.3% m/m decline was to the lowest level in nearly one year.
Less the transportation sector altogether, durable goods orders fell 1.3% following an upwardly revised 1.6% January increase. The decline disappointed Consensus expectations for a 1.1% increase.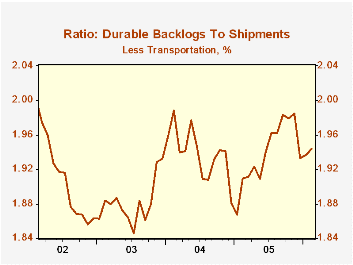
Declines in orders were widespread during February. Electrical equipment orders fell 3.2% (+12.5% y/y) though the decline followed an 8.5% gain the month earlier which was quite a bit stronger than initially estimated. A 6.3% (+4.4% y/y) drop in machinery orders followed a 3.5% January slip while orders for fabricated metals fell 1.9% (+5.6% y/y) and primary metals also fell by 2.5% (+6.0% y/y). Orders for computers & electronic products rose 4.2% (2.9% y/y) though the y/y gain is well below the double digit increases of 2004 and 2005.
Orders for nondefense capital goods increased a scant 1.6% following the 19.8% plunge during January and orders less aircraft fell 2.3%. The January figures were little revised.
During the last ten years there has been an 87% correlation between the y/y change in capital goods orders less aircraft and the y/y change in business fixed investment in equipment & software from the GDP accounts.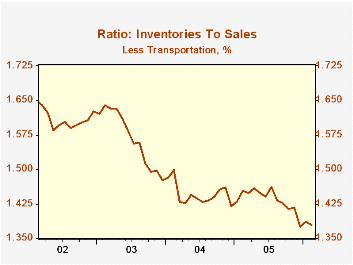
Shipments of durable goods rose 0.2% after the 1.8% drop during January and less the transportation sector shipments rose 0.1% (8.3% y/y) following the 0.5% January increase.
Order backlogs rose 0.9% (17.0% y/y), again dominated by the strength in unfilled orders for aircraft & parts which rose 1.1% (39.3% y/y). Less transportation backlogs rose 0.5% (10.2% y/y). The ratio of backlogs to shipments outside of transportation increased moderately but remained near the middle of the range of the last two years.
Durable inventories fell 0.5% (+2.6% y/y) after a 1.0% January gain. Less transportation, the 0.4% (+2.8% y/y) February decline followed a 1.2% January surge. The inventory to sales ratio outside of the transportation sector fell to near the historic low.
Macroeconomic News and Real Interest Rates from the Federal Reserve Bank of St. Louis can be found here.
| NAICS Classification | Feb | Jan | Y/Y | 2005 | 2004 | 2003 |
|---|---|---|---|---|---|---|
| Durable Goods Orders | 2.6% | -8.9% | 8.1% | 8.6% | 9.5% | 4.1% |
| Excluding Transportation | -1.3% | 1.6% | 6.4% | 8.6% | 11.7% | 3.1% |
| Nondefense Capital Goods | 1.6% | -19.8% | 9.4% | 20.0% | 11.0% | 4.2% |
| Excluding Aircraft | -2.3% | 0.3% | 5.0% | 10.7% | 9.5% | 4.8% |
by Louise Curley March 27, 2006
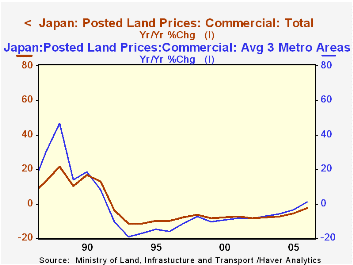
Further evidence that deflation in Japan is becoming a thing of the past is showing up in land prices. Commercial land prices in the three metropolitan areas--Tokyo, Osaka and Nagoya--rose last year for the first time since the peak in Japan's land prices was reached in the first half of 1991. After fourteen years of ever lower prices, the price of commercial land in the three metropolitan areas rose 1.0% in 2005.Nationwide, prices of commercial land were still falling, but the decline has been decelerating and in 2005 was 2.7% versus 5.6% the year before. The first chart shows the annual percentage changes in the prices of commercial land in the three metropolitan areas and in the nation as a whole for the past twenty years.Residential land prices have not yet shown an increase but the declines have been moderating both in the metropolitan areas and in the nation as a whole, as the second chart shows.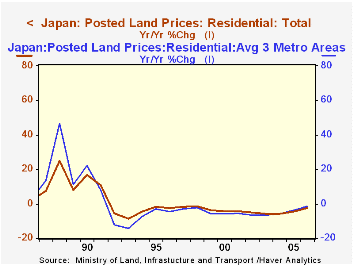
These price changes are published by the Department of Land, Infrastructure and Transport annually. Percentage changes from a year ago are shown on January 1st of each year, the latest being January 1, 2006. Indexes of urban land prices (End of March =100) are compiled and published by the Japan Real Estate Institute semiannually in March and September. The March figure is representative of the first half of the year and the September figure, the second half. The index of is based on conditions in some 223 cities.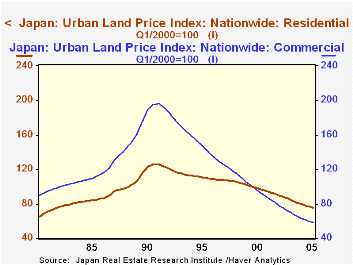
The indexes give a good picture of the rise and fall of land prices in urban areas. The rise of land prices in the boom of the eighties was more pronounced in commercial land prices than in residential land prices. Between 1980 and 1991 commercial land prices rose almost 130% and have subsequently declined 70%. The index of commercial land prices was 58.60 in the last half of 2005 below the level of the index in the first half of 1980. The rise in residential land prices was less, 108%, and the subsequent decline has been more muted, 40%. The Index of residential land prices was 75.60 in the last half of 2005, still above the 60.60 of the first half of 1980. The rise and fall of commercial and residential land prices are shown in the third chart.
| Percent Changes in Land Prices (%) | 2005 | 2004 | 2003 | 2002 | 2001 | 2000 |
|---|---|---|---|---|---|---|
| Commercial | ||||||
| Metropolitan Areas | 1.0 | -3.2 | -5.8 | -7.1 | 8.5 | -9.6 |
| Nationwide | -2.7 | -5.6 | -7.4 | -8.0 | -8.3 | -8.0 |
| Residential | ||||||
| Metropolitan Areas | -1.2 | -3.7 | -5.7 | -6.5 | -5.6 | -5.9 |
| Nationwide | -2.7 | -4.6 | -5.7 | -5.8 | -5.2 | -4.1 |
| Urban Land Price Index (End of March 2000=100) |
1980 | Peak 1991 | Current Second half 2005 |
1980-Peak % Change |
Peak-Current % Change |
-- |
| Commercial Land | 86.00 | 195.90 | 58.60 | 127.79 | -70.09 | -- |
| Residential Land | 60.61 | 126.10 | 75.60 | 108.09 | -40.05 | -- |

Tom Moeller
AuthorMore in Author Profile »Prior to joining Haver Analytics in 2000, Mr. Moeller worked as the Economist at Chancellor Capital Management from 1985 to 1999. There, he developed comprehensive economic forecasts and interpreted economic data for equity and fixed income portfolio managers. Also at Chancellor, Mr. Moeller worked as an equity analyst and was responsible for researching and rating companies in the economically sensitive automobile and housing industries for investment in Chancellor’s equity portfolio. Prior to joining Chancellor, Mr. Moeller was an Economist at Citibank from 1979 to 1984. He also analyzed pricing behavior in the metals industry for the Council on Wage and Price Stability in Washington, D.C. In 1999, Mr. Moeller received the award for most accurate forecast from the Forecasters' Club of New York. From 1990 to 1992 he was President of the New York Association for Business Economists. Mr. Moeller earned an M.B.A. in Finance from Fordham University, where he graduated in 1987. He holds a Bachelor of Arts in Economics from George Washington University.
More Economy in Brief


